Original Link: https://www.anandtech.com/show/9483/intel-skylake-review-6700k-6600k-ddr4-ddr3-ipc-6th-generation
The Intel 6th Gen Skylake Review: Core i7-6700K and i5-6600K Tested
by Ian Cutress on August 5, 2015 8:00 AM EST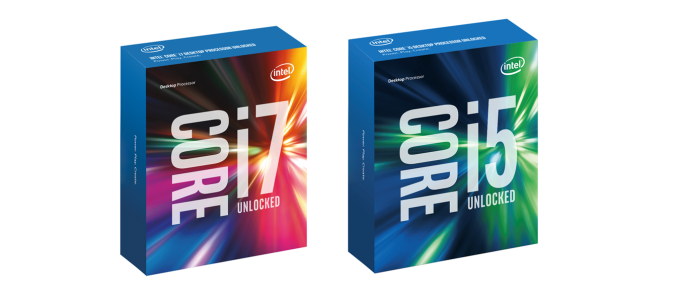
It’s the Intel review you’ve been waiting for. Today is the launch of the first two CPUs from Intel’s Skylake architecture, the 6th Generation Core i7-6700K and the Core i5-6600K. With the new processors we get a new architecture, a new socket, the move to DDR4 and the potential to increase both performance and efficiency at the same time. A lot of readers have asked the question – is it time to upgrade? We had a CPU or two in to test to answer that question.
Launch Day for Skylake-K: August 5th
For those in the industry, predicting Skylake’s launch has been a minefield. Even at Computex in June, some companies were discussing a large six-week window in which they expected Skylake but were waiting on official dates. But as we've seen with a number of previous Intel mainstream launches, Intel likes to aim at the gaming crowds release at a gaming events. It just so happens that today is Gamescom in Germany, two weeks before what everyone expected would be a launch at Intel’s Developer Forum in mid-August.
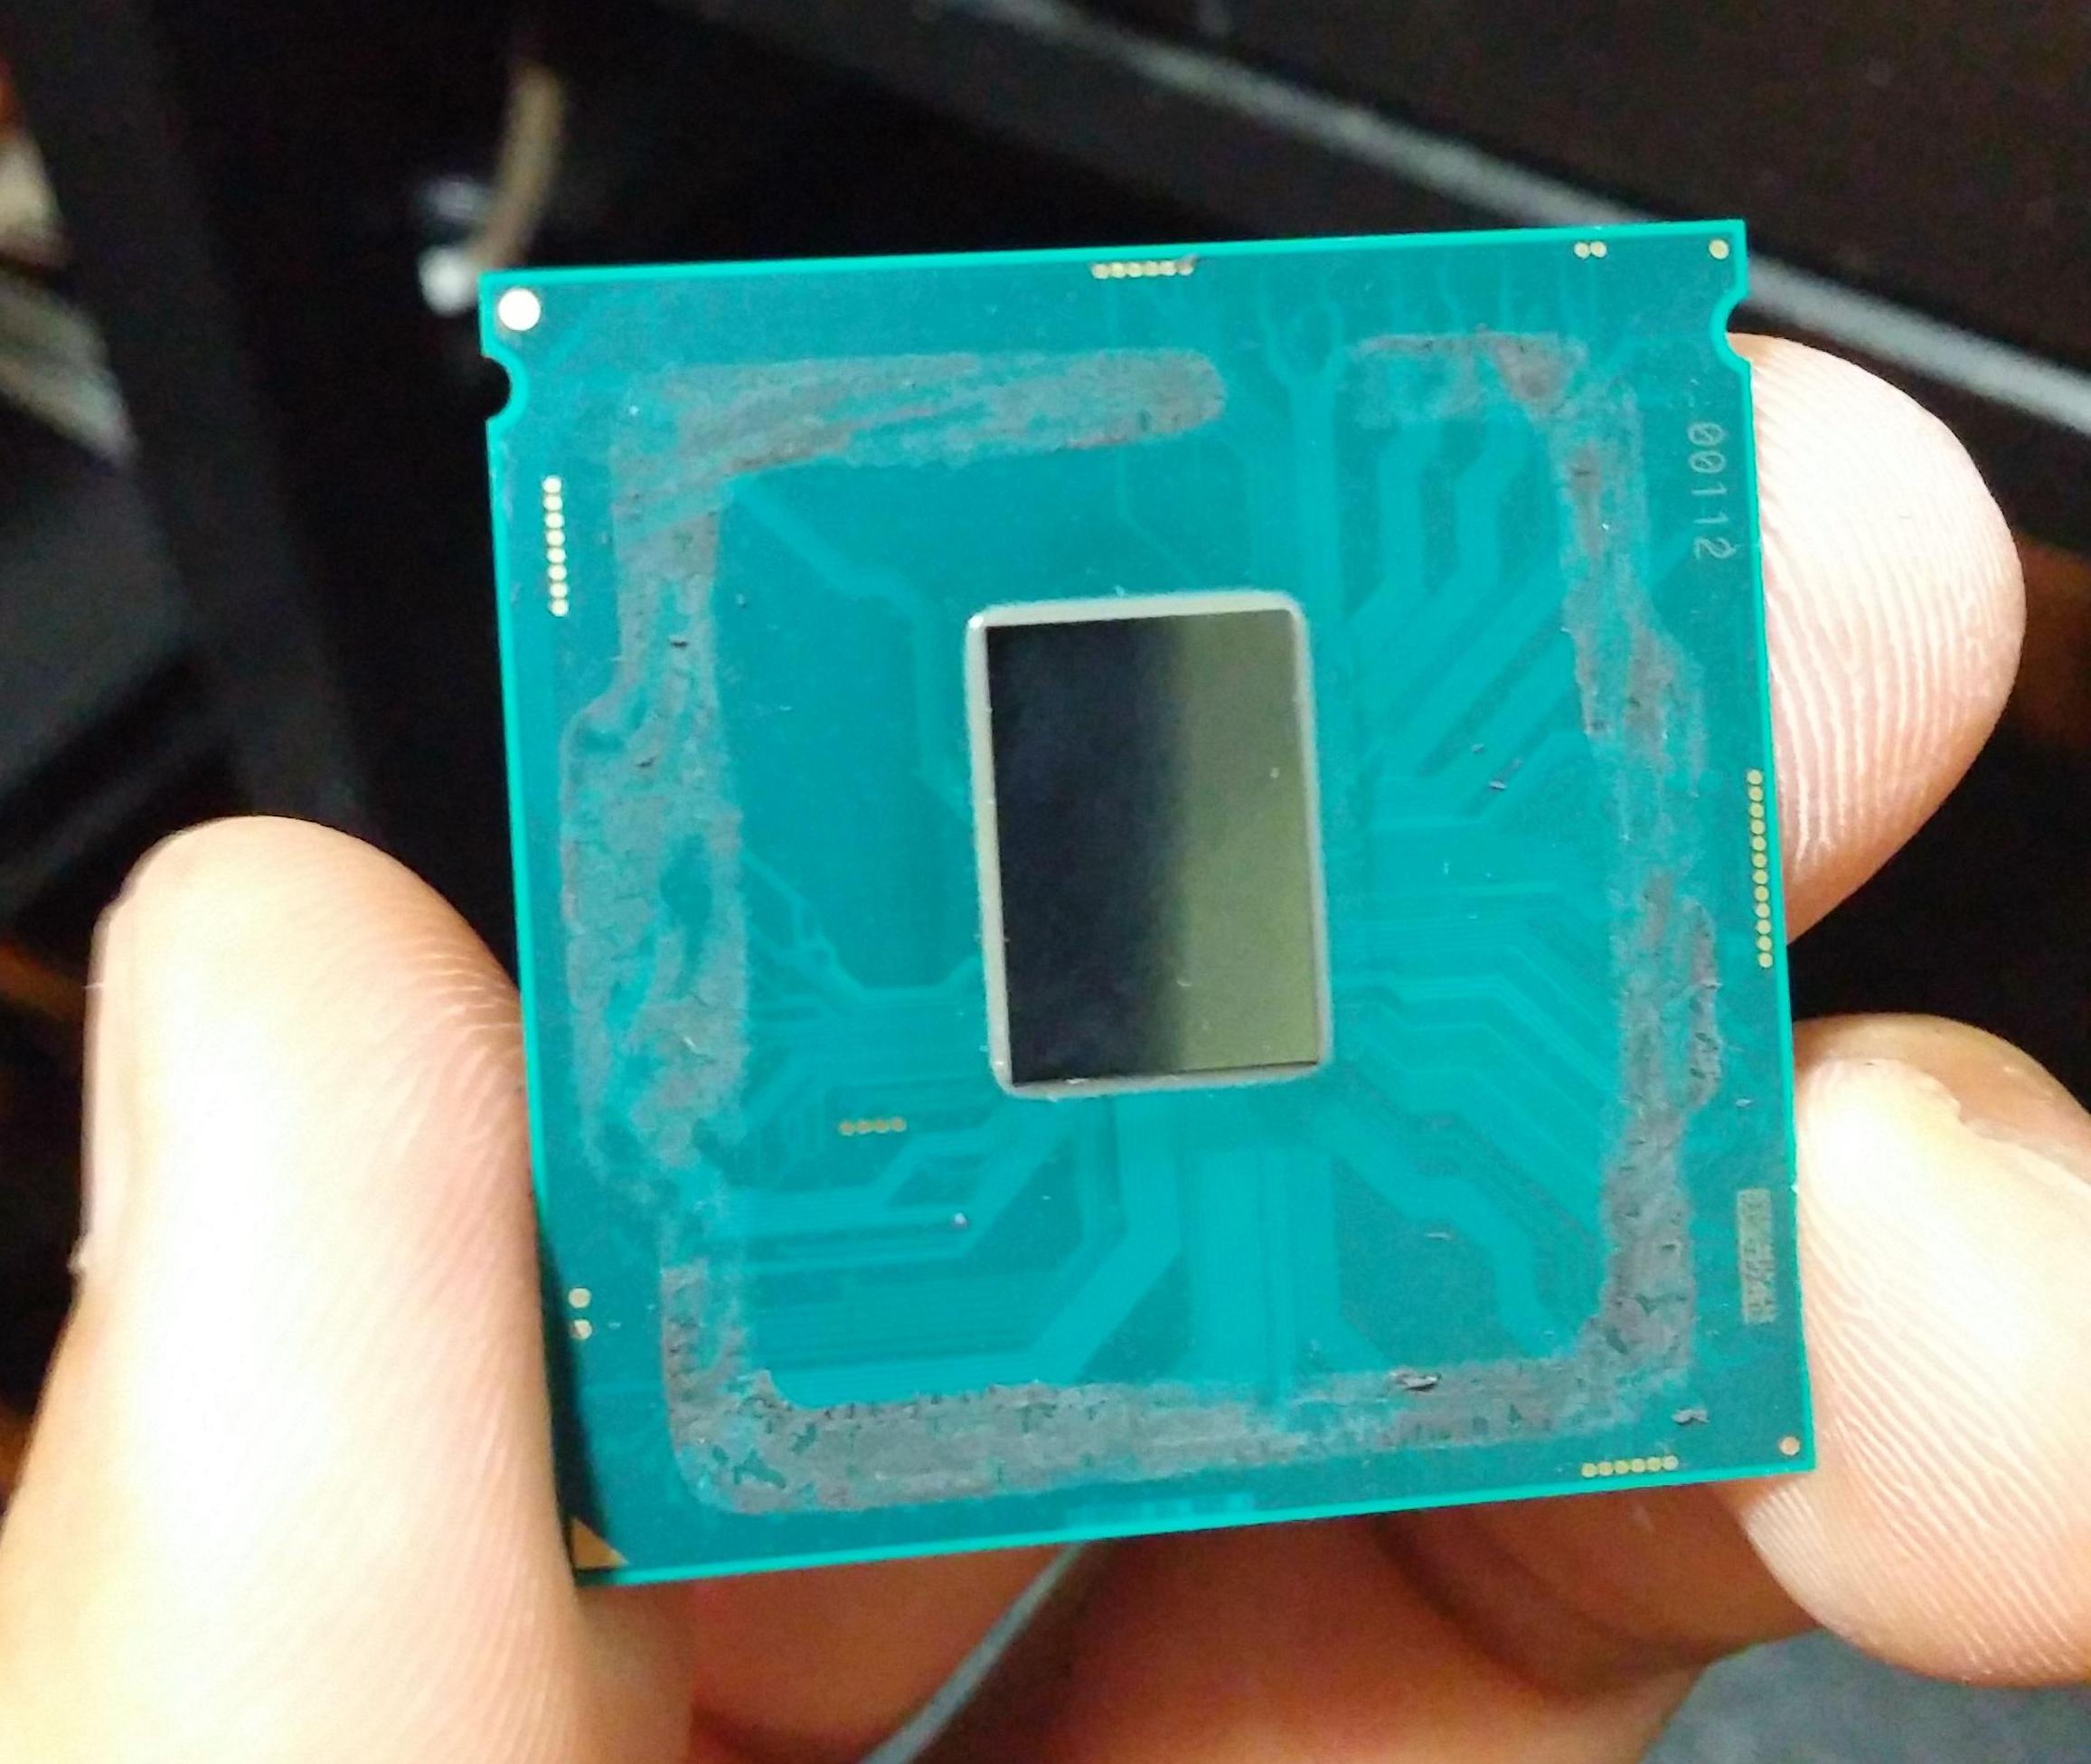
Image courtesy of Splave
Today is a full launch for the Skylake-K processors, with the two CPUs being launched alongside new Z170 series motherboards and dual channel DDR4 memory kits. Having spoken to a few retailers, they have stock ready to go today. That being said, a number of them would have liked more stock on launch day, suggesting that they expect the processors to sell out rather quickly when the buy buttons are activated.
All the motherboard manufacturers should be ready to go as well – take a look at our breakdown of the retail motherboard information we could get before launch for a good overview of what to expect this generation. DDR4 manufacturers have been selling the new standard of memory for over a year due to Intel’s high-end X99 platform supporting it, but today will see the introduction of dual channel kits to go with the Skylake platform as well as a number of higher speed modules ready and waiting.
‘Where are the non-K processors?!’ you may ask. Intel tells us that these will be released later in the year, sometime in Q3. As a result, we have to wait and see what range of models come out at that point and we will get a number in to review.
Retail Packaging
To go with the launch is a new look of Intel's Core processor packaging, in part to appeal to the gaming crowd. As the gaming industry is considered one of the few remaining areas for potentially large growth in the PC industry, Intel is increasing its focus on gaming as a result.

Aside from changing the graphics on the box, it has been reported – and seemingly confirmed by the thinner boxes in the official pictures from Intel – that these processors will not be shipped with a stock Intel cooler. Users will have to purchase third party coolers. Part of this makes sense – overclocking processors need beefier cooling in order to extract the maximum overclock and buying something above the stock cooler should be good. The downside of not having a stock cooler means an added cost to the end user. However as the hole mounting for the new socket, LGA1151, is similar to that of LGA1150/1155/1156 – spacing is still 75mm – many existing CPU coolers for the current LGA115x sockets should be compatible, making it possible to reuse many coolers for no more than the cost of a new thermal paste application.
For users looking for a new air or liquid cooler, head on over to our recent roundup of Top Tier CPU Air Coolers Q3 2015: 9-Way Roundup Review and the Closed Loop AIO Liquid Coolers: 14-way Mega Roundup Review published last year.
The Skylake CPUs: Intel’s 6th Generation Core
Intel’s tick-tock strategy has been the bedrock of their application to bring new processors to the market, growing in terms of user experience for either power, efficiency, or both. It has been noted that certain generations either have an enterprise focus or a mobile-first focus, which always seems to tip the scales in one direction of the other. However, with the recent announcement of a third CPU line at 14nm called Kaby Lake for 2016, tick-tock just became tick-tock-tock.
| Intel's Tick-Tock Cadence | |||||
| Microarchitecture | Process Node | Tick or Tock | Release Year | ||
| Conroe/Merom | 65nm | Tock | 2006 | ||
| Penryn | 45nm | Tick | 2007 | ||
| Nehalem | 45nm | Tock | 2008 | ||
| Westmere | 32nm | Tick | 2010 | ||
| Sandy Bridge | 32nm | Tock | 2011 | ||
| Ivy Bridge | 22nm | Tick | 2012 | ||
| Haswell | 22nm | Tock | 2013 | ||
| Broadwell | 14nm | Tick | 2014 | ||
| Skylake | 14nm | Tock | 2015 | ||
| Kaby Lake (link)? | 14nm | Tock | 2016 ? | ||
Intel’s early issues with 14nm yields have been well documented and we won’t go into them here, but 14nm is a more expensive process with an increased number of lithography steps as we reach the limits of current semiconductor technology. FinFET was introduced back in 22nm, but to move down to 10nm makes either the current process more expensive or other methods have to be used. As a result, we see Moore’s Law stretching out from an 18-24 month cadence to a 24-30 month cadence for the first time in fifty years. As we’ve seen with the graphics card market recently stalling at 28nm, there is a need (or at least opportunity) to develop more power efficient architectures rather than just relying on die shrinks to do it for you.
Future development aside, today Skylake will hit the shelves in the form of two overclockable processors, the Core i7-6700K and the Core i5-6600K.
| Intel i7 Lineup | |||
| i7-4770K | i7-5775C | i7-6700K | |
| Price | $339 | $366 | $350 |
| Cores | 4 | 4 | 4 |
| Threads | 8 | 8 | 8 |
| Base CPU Freq. | 3.5 GHz | 3.3 GHz | 4.0 GHz |
| Turbo CPU Freq. | 3.9 GHz | 3.7 GHz | 4.2 GHz |
| Graphics | HD 4600 (GT2) | Iris Pro 6200 (GT3e) | HD 530 (GT2) |
| EUs | 20 | 48 | 24 |
| iGPU Freq. | 1250MHz | 1100MHz | 1150MHz |
| TDP | 84W | 65W | 91W |
| DDR3/L Freq. | 1600MHz | 1600MHz | 1600MHz |
| DDR4 Freq. | - | - | 2133MHz |
| L3 Cache | 8MB | 6MB | 8MB |
| L4 Cache | None | 128MB (Crystal Well) | None |
| Interface | LGA1150 | LGA1150 | LGA1151 |
As with previous nomenclature, the i7 model will be quad core CPU with HyperThreading and 8MB of L3 cache. This matches up with the Haswell parts to which Skylake is more closely aligned (Desktop Broadwell is rather a blip, using an external on-package eDRAM and you can read our review here), in a large number of aspects including the other cache levels. The 6700K runs at a base frequency of 4.0 GHz and an all-core frequency of 4.2 GHz. This is a slight speed bump over the 4770K which was launched at the start of Haswell, but a minor reduction in clockspeeds compared to the i7-4790K, which was an upgraded Haswell part launched later under the name of ‘Devil’s Canyon’.
The integrated graphics nomenclature has changed, with the new i7-6700K having the Intel HD 530 graphics, compared to the HD4600 in the Haswell parts. We know that the HD 530, like the HD 4600, has 24 of Intel’s execution units in the iGPU, and they run at a peak frequency of 1150 MHz. The introduction of the HD 530 marks the launch of Intel’s 9th generation graphics, and we'll cover Gen9 in a bit more detail later.
| Intel i5 Lineup | |||
| i5-4670K | i5-5675C | i5-6600K | |
| Price | $242 | $276 | $243 |
| Cores | 4 | 4 | 4 |
| Threads | 4 | 4 | 4 |
| Base CPU Freq. | 3.4 GHz | 3.1 GHz | 3.5 GHz |
| Turbo CPU Freq. | 3.8 GHz | 3.6 GHz | 3.9 GHz |
| Graphics | HD 4600 (GT2) | Iris Pro 6200 (GT3e) | HD 530 (GT2) |
| EUs | 20 | 48 | 24 |
| iGPU Freq. | 1200MHz | 1100MHz | 1150MHz ? |
| TDP | 84W | 65W | 91W |
| DDR3/L Freq. | 1600MHz | 1600MHz | 1600MHz |
| DDR4 Freq. | - | - | 2133MHz |
| L3 Cache | 6MB | 4MB | 6MB |
| L4 Cache | None | 128MB (Crystal Well) | None |
| Interface | LGA1150 | LGA1150 | LGA1151 |
The i5 model for Skylake also has quad cores, but without HyperThreading and only 6MB of L3 cache. Like the i7, it also has the Intel HD 530 graphics but operates at a lower frequency band.

Both the Skylake processors will support DDR4 and DDR3L memory in order to ease the transition to DDR4 for the mainstream segment, although it should be said that DDR3L is implemented here due to its lower than standard DDR3 operating voltage of 1.35 volts. This more closely aligns with DDR4’s standard voltage of 1.20 volts or the high end DDR4 kits at 1.35 volts, and as a result we are told that motherboards that support DDR3L will typically only be qualified to run DDR3L kits, rather than DDR3 kits.
This leads onto the point that both of the K processors for Skylake sit at 91W, which is a small increase over Haswell at 84W and Devil’s Canyon at 88W. In the past Intel has historically run a 1:1 policy whereby a 1% performance gain must come at a maximum of a 1% power penalty – this was adjust to 2:1 for Broadwell, and we should assume that Skylake had similar requirements during the planning stage. Depending on the specific architecture details, one potential source for this increase in power consumption may be the dual memory controller design, although Skylake has a significant number of features to differentiate itself from Haswell.
Also Launching Today: Z170 Motherboards, Dual Channel DDR4 Kits
The new Skylake processors are assigned a new socket – LGA1151. Intel’s policy since 2006 has been to maintain sockets for two generations and as a result moving from Broadwell to Skylake we were expecting the change. This means that Skylake processors will not work in LGA1150 based motherboards, i.e. those with Intel’s 8th and 9th generation chipsets. For Skylake we get the 100-series chipsets with additional functionality. Launching today in turn is the first member of the 100-series family, the overclocking-friendly Z170, with the other chipsets in the family to follow later in the year.
We have a large piece on the motherboards being released or talked about for Skylake, covering some 55+ products and the different variations within. The major motherboard manufacturers such as ASUS, GIGABYTE, ASRock, MSI, EVGA and a couple of others should all have a wide range ready to purchase on day one, although some models may be region specific.
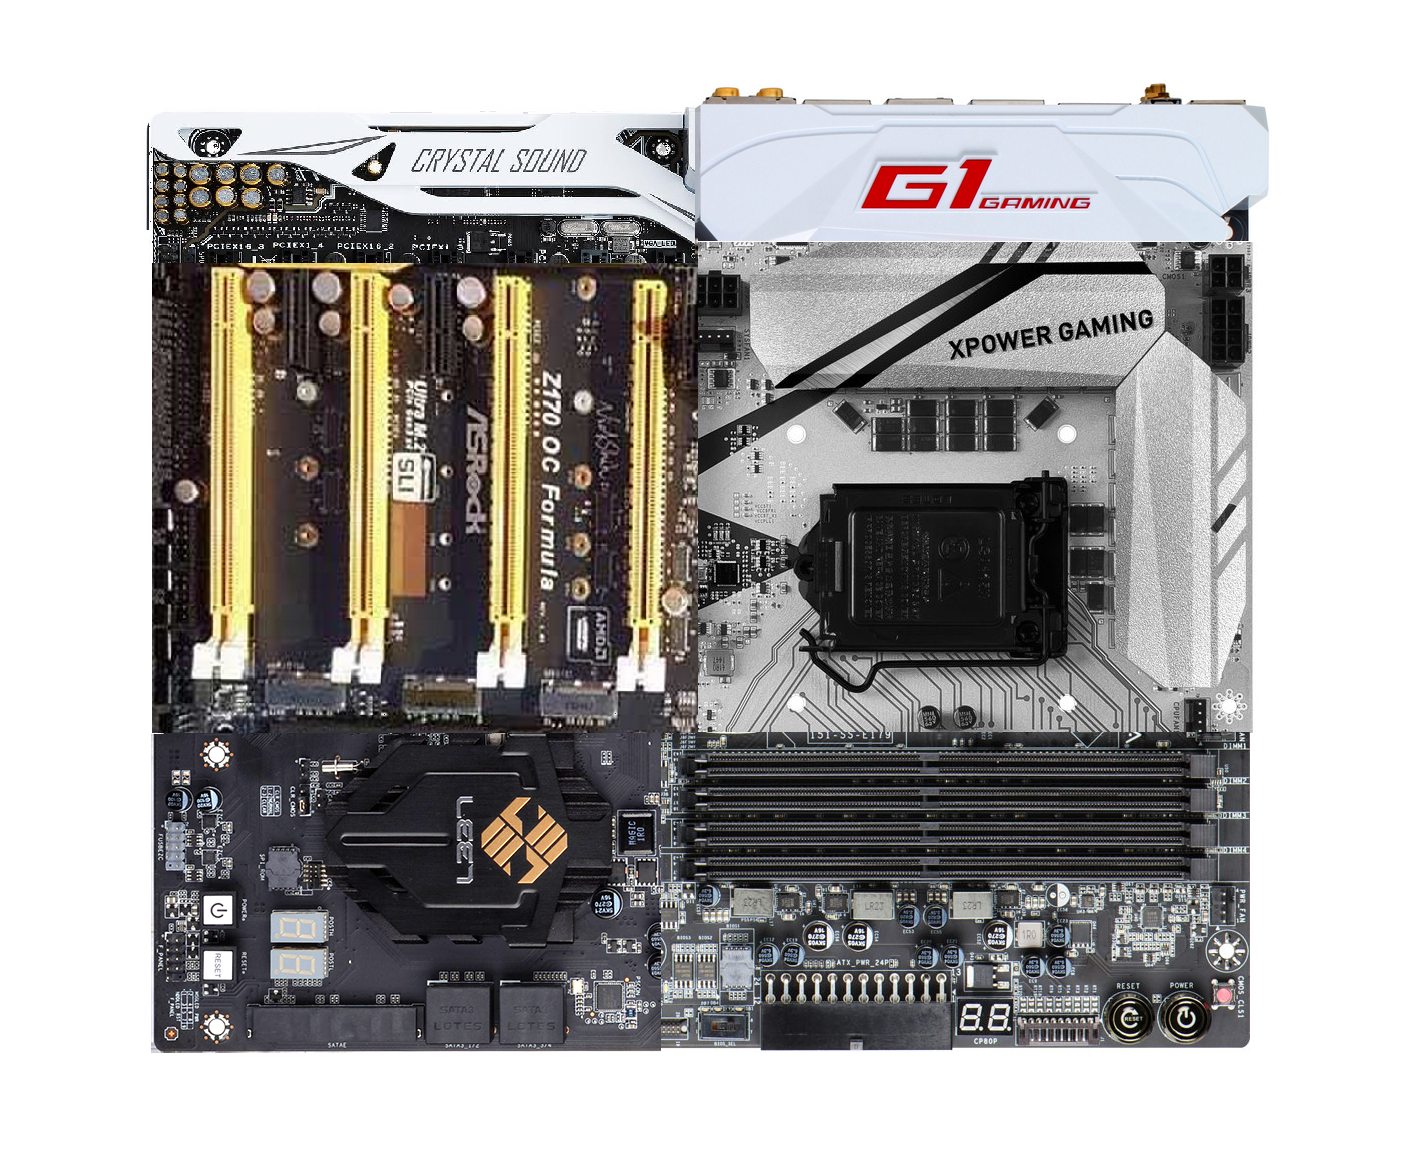
The badly MSPaint’ed hybrid: MSI’s XPower Gaming Socket, GIGABYTE’s G1 Gaming IO panel, EVGA’s DRAM slots, ECS’s chipset, ASRock’s PCIe arrangement and ASUS’ Deluxe audio.
Here’s an amalgamation of some of the designs coming to end users, with almost all of them investing heavily in gaming brands with specific components to aid the user experience while gaming. Aesthetic designs are also going to be a focus of this generation, with some of the manufacturers moving into a different direction with their designs and trying some new color schemes. Some basic looking models will also be available.
Prices for Z170 motherboards will range from $80 all the way past $400+, depending on feature set and size. A number of motherboards above $150 will feature a couple USB 3.1 Gen 2 (10Gbps) ports, although you will have to check whether they are Type-A or Type-C. That being said, most motherboards with USB 3.1 will use both, but there are a select few that are C-only or A-only. Also over $150 we will see a lot of Intel’s new network controller, the I219-V, although the gaming lines might invest in Rivet Network’s Killer solution instead.
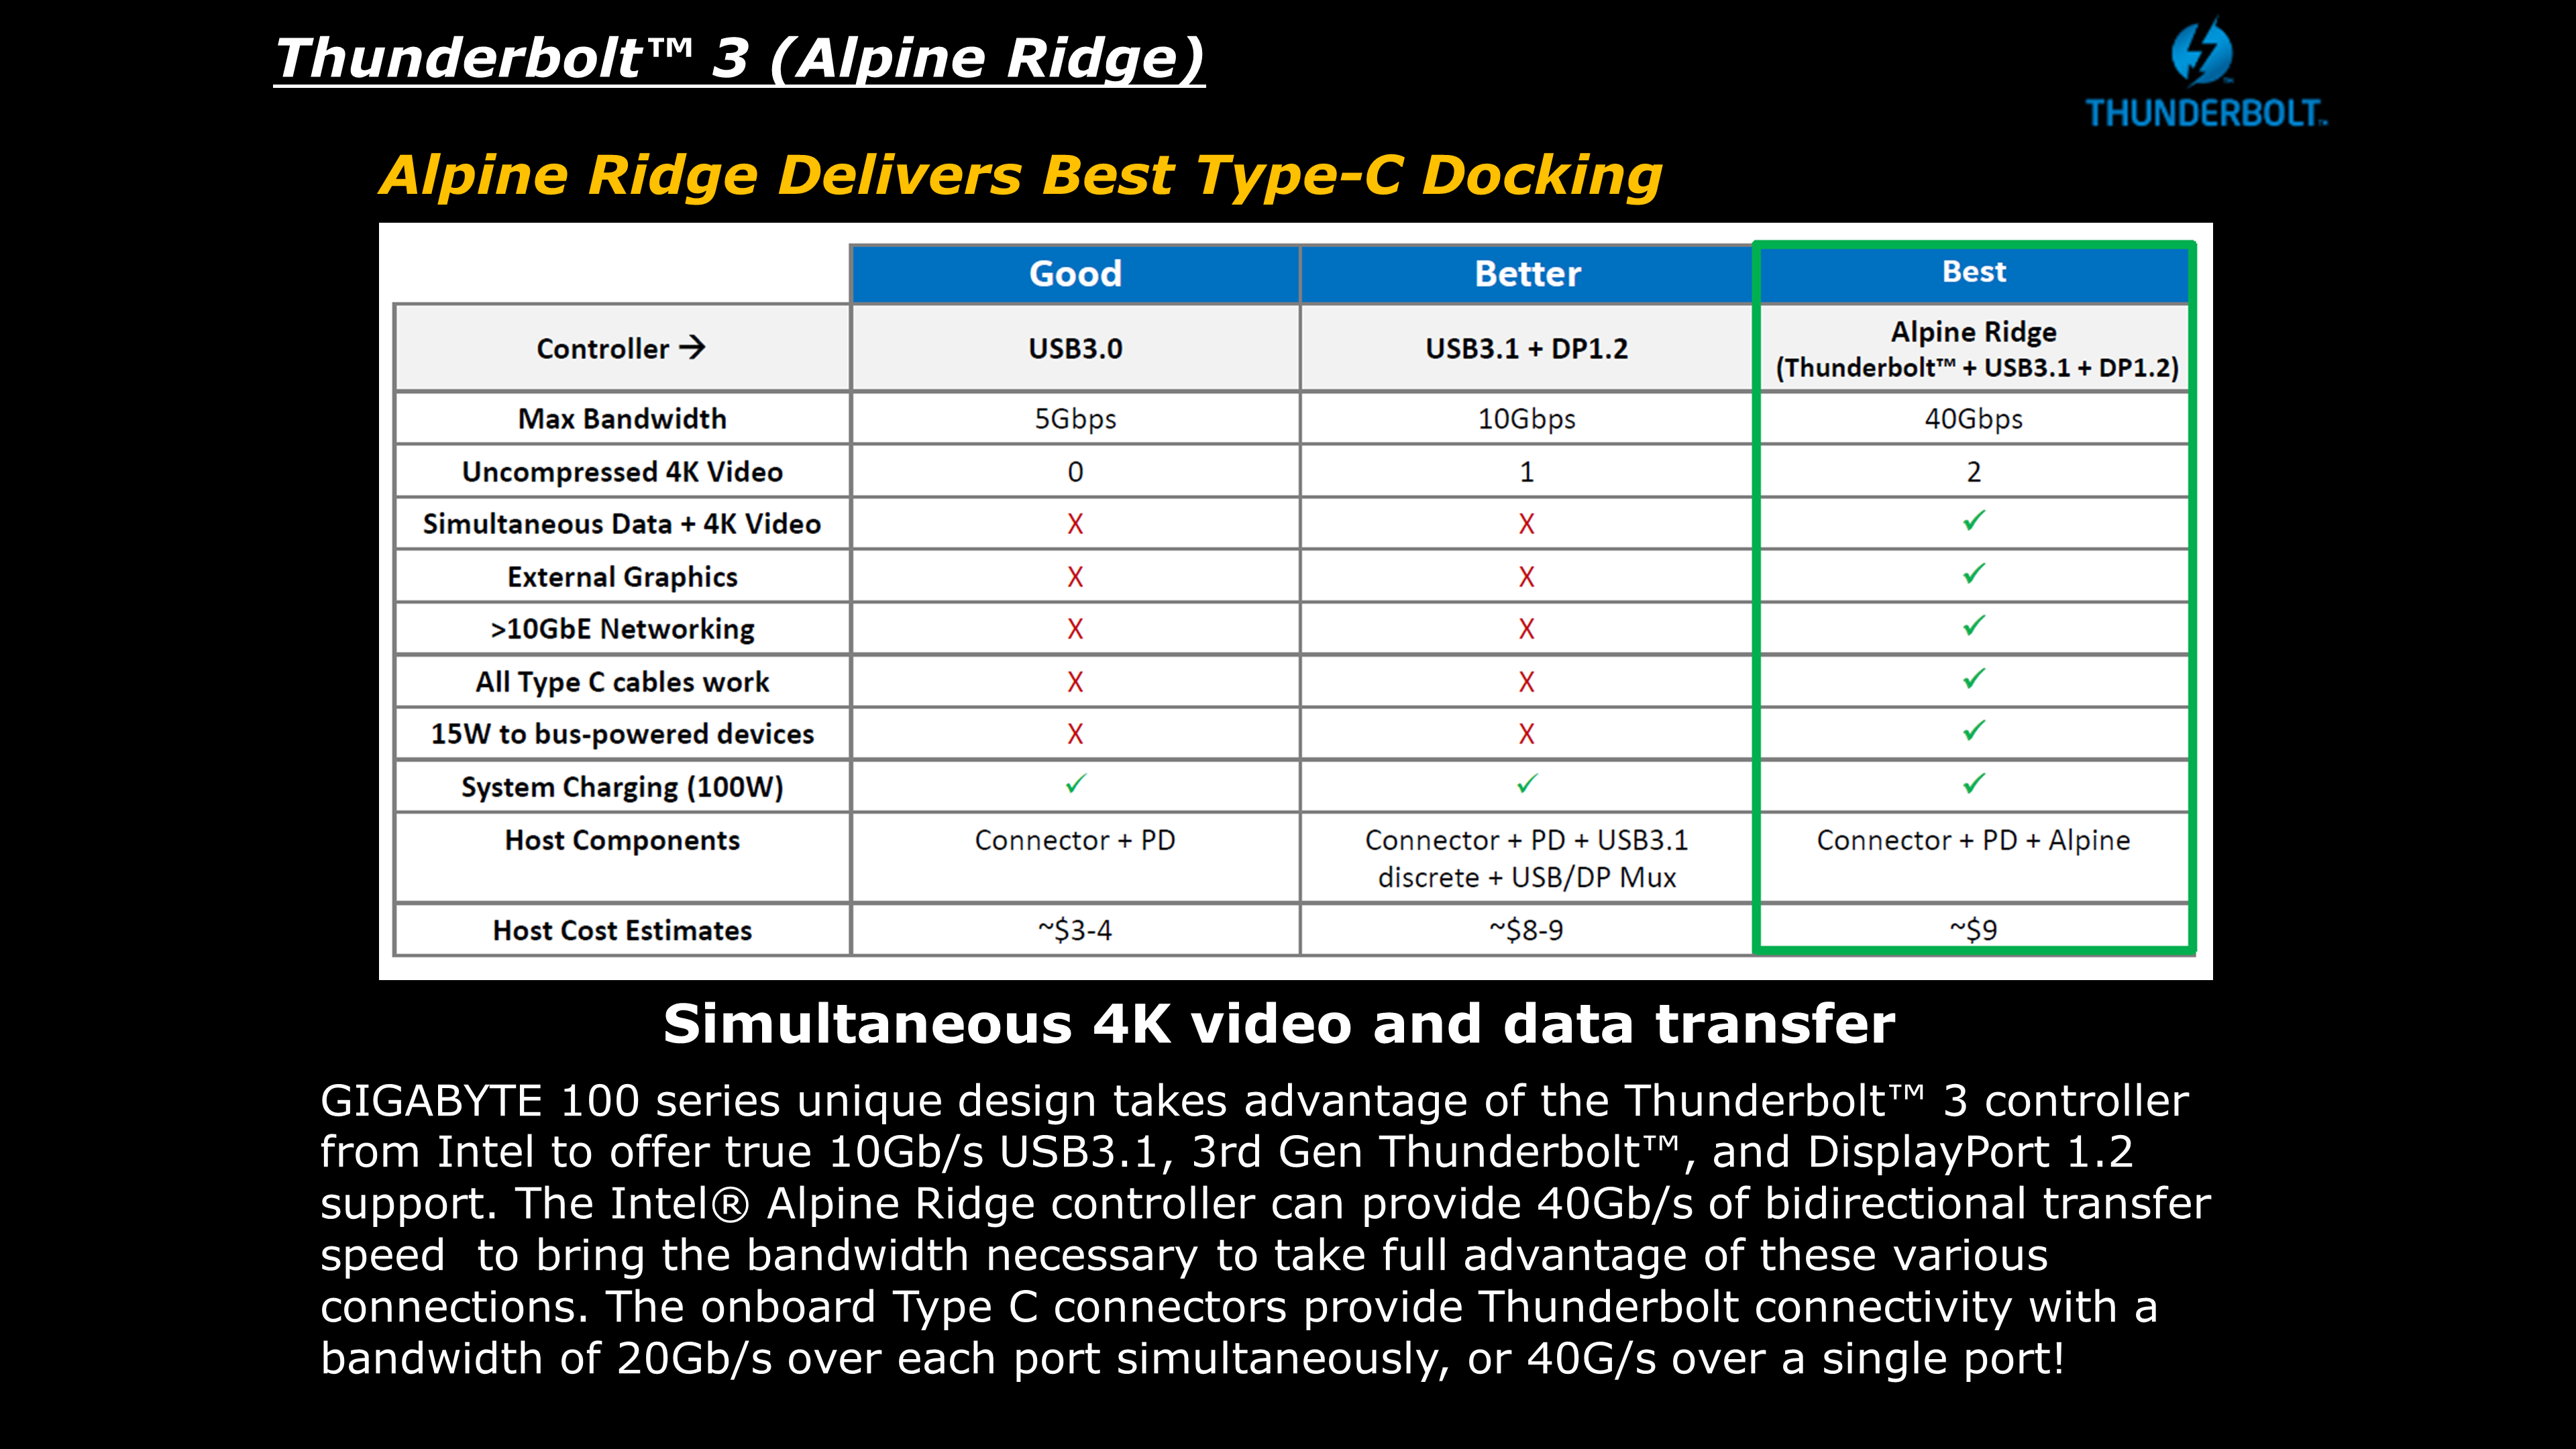
Intel is launching the Alpine Ridge controller at this time as well, which is said to support USB 3.1 Gen 2, Thunderbolt 3, HDMI 2.0, DisplayPort, and DockPort. According to our sources it would seem that GIGABYTE currently has an exclusive on this technology, and it will be used for their USB 3.1 Gen 2 ports on most motherboard models. Other functionality from the Alpine Ridge controller (TB3, HDMI 2.0) will be on a case-by-case basis depending on how the controller works in two different modes or if extra components are used. We are told that Alpine Ridge costs similarly to the ASMedia ASM1142 controller, but will enable two USB 3.1 Gen 2 ports at 10 Gbps simultaneously as it uses four PCIe lanes from the chipset.
We will go more into the 100-series chipset in the next page, but it is worth mentioning briefly here that the speed between the CPU and the chipset has increased from DMI 2.0 (5 GT/s, 2GB/sec) to DMI 3.0 (8 GT/s, 3.93GB/sec), and that the chipset has a new high speed hub (HSIO) that allows 26 lanes to be used from it although some lanes are limited (e.g. 20 PCIe 3.0 lanes maximum split into five x4 controllers). Intel’s Rapid Storage Technology is upgraded as well to give three PCIe drives access to its features as long as they are on the correct HSIO ports.
DRAM: The March to DDR4
In the world of DRAM for personal computers, DDR3 is currently king. Having been the main standard since 2007, you would be hard pressed to find a mainstream or low end platform sold that did not require access to DDR3. That changed in the enthusiast segment last year with the launch of Haswell-E which also introduced DDR4 at a high premium. For Haswell-E there was no crossover – you had no choice but to use DDR4 (unless you might be a million-unit customer).
Because the consumers and consumer product OEMs are more price sensitive, DDR4 will be a slower transition. There is precedent here in that the move from DDR2 to DDR3 saw a generation of processors that supported both standards and it was up to the motherboard manufacturer to design for it. In this transition, Skylake processors will support both DDR3L and DDR4 modules, with a few caveats.
Caveat number one is that initially, only DDR4 motherboards will be on the market. So if you upgrade now, DDR4 needs to be on the shopping list as well. We have had word of some DDR3L-only motherboards coming, as well as combo boards with DDR3L and DDR4 slots on board. Caveat one-point-five, you can use either DDR3L or DDR4, but not both at the same time.
Caveat number two, DDR3L is different to DDR3 as it operates at a lower voltage. This means that the memory controllers on Skylake most likely have a combined voltage domain, and regular DDR3 might not work (in fact early testing suggests not without reducing the voltage). Very few people currently own DDR3L DIMMs, so the likelihood of a user performing an upgrade while reusing their RAM might be slim.
Caveat number three: prices of DDR4 have dropped significantly since last year, and there is only a small premium over DDR3. The benefits of DDR4 include a lower operating voltage, a more stable design, and the ability to purchase 16GB modules with ease. That means that a Skylake platform will happily take 64GB of memory.
With that last point, we should point out that Skylake is a dual memory channel architecture, supporting two memory modules per channel. This gives a maximum of four DDR4 tests, and 4x16 = 64GB maximum.
We have been told that Skylake’s memory controller, compared to previous generations, is absolutely golden at higher speed memory support. By default Skylake supports the JEDEC standard for DDR4, 2133 MT/s at a latency of 15-15-15, but the overclocking guides we have received suggests that all processors should be able to reach DDR4-3200 relatively comfortably, with a few processors in the right motherboards going for DDR4-4000. While this should bode well for integrated graphics users, those high end kits are typically very expensive.
We currently have dual channel kits in to test from a number of the DRAM companies, and plan on performing a memory scaling article within the next few weeks to see how exactly performance might scale on Skylake. Though in the meantime, as part of this review, we were able to source a closed beta variant of a combination DDR3L/DDR4 motherboard for Skylake and have included a test comparing the two.
The Skylake CPU Architecture
As with any new Intel architecture, the devil is in the details. Previously at AnandTech we have been able to provide deep dives into what exactly is going on in the belly of the beast, although the launch of Skylake has posed a fair share of problems.
Nominally we rely on a certain amount of openness from the processor/SoC manufacturer in providing low level details that we can verify and/or explain. In the past, this information has typically been provided in advance of the launch by way of several meetings/consultations with discussions talking to the engineers. There are some things we can probe, but others are like a black box. The black box nature of some elements, such as Qualcomm’s Adreno graphics, means that it will remain a mystery until Pandora’s box is opened.
In the lead up to the launch of Intel’s Skylake platform, architecture details have been both thin on the ground and thin in the air, even when it comes down to fundamental details about the EU counts of the integrated graphics, or explanations regarding the change in processor naming scheme. In almost all circumstances, we’ve been told to wait until Intel’s Developer Forum in mid-August for the main reason that the launch today is not the full stack Skylake launch, which will take place later in the quarter. Both Ryan and I will be at IDF taking fastidious notes and asking questions for everyone, but at this point in time a good portion of our analysis comes from information provided by sources other than Intel, and while we trust it, we can't fully verify it as we normally would.
As a result, the details on the following few pages have been formed through investigation, discussion and collaboration outside the normal channels, and may be updated as more information is discovered or confirmed. Some of this information is mirrored in our other coverage in order to offer a complete picture in each article as well. After IDF we plan to put together a more detailed architecture piece as a fundamental block in analyzing our end results.
The CPU
As bad as it sounds, the best image of the underlying processor architecture is the block diagram:
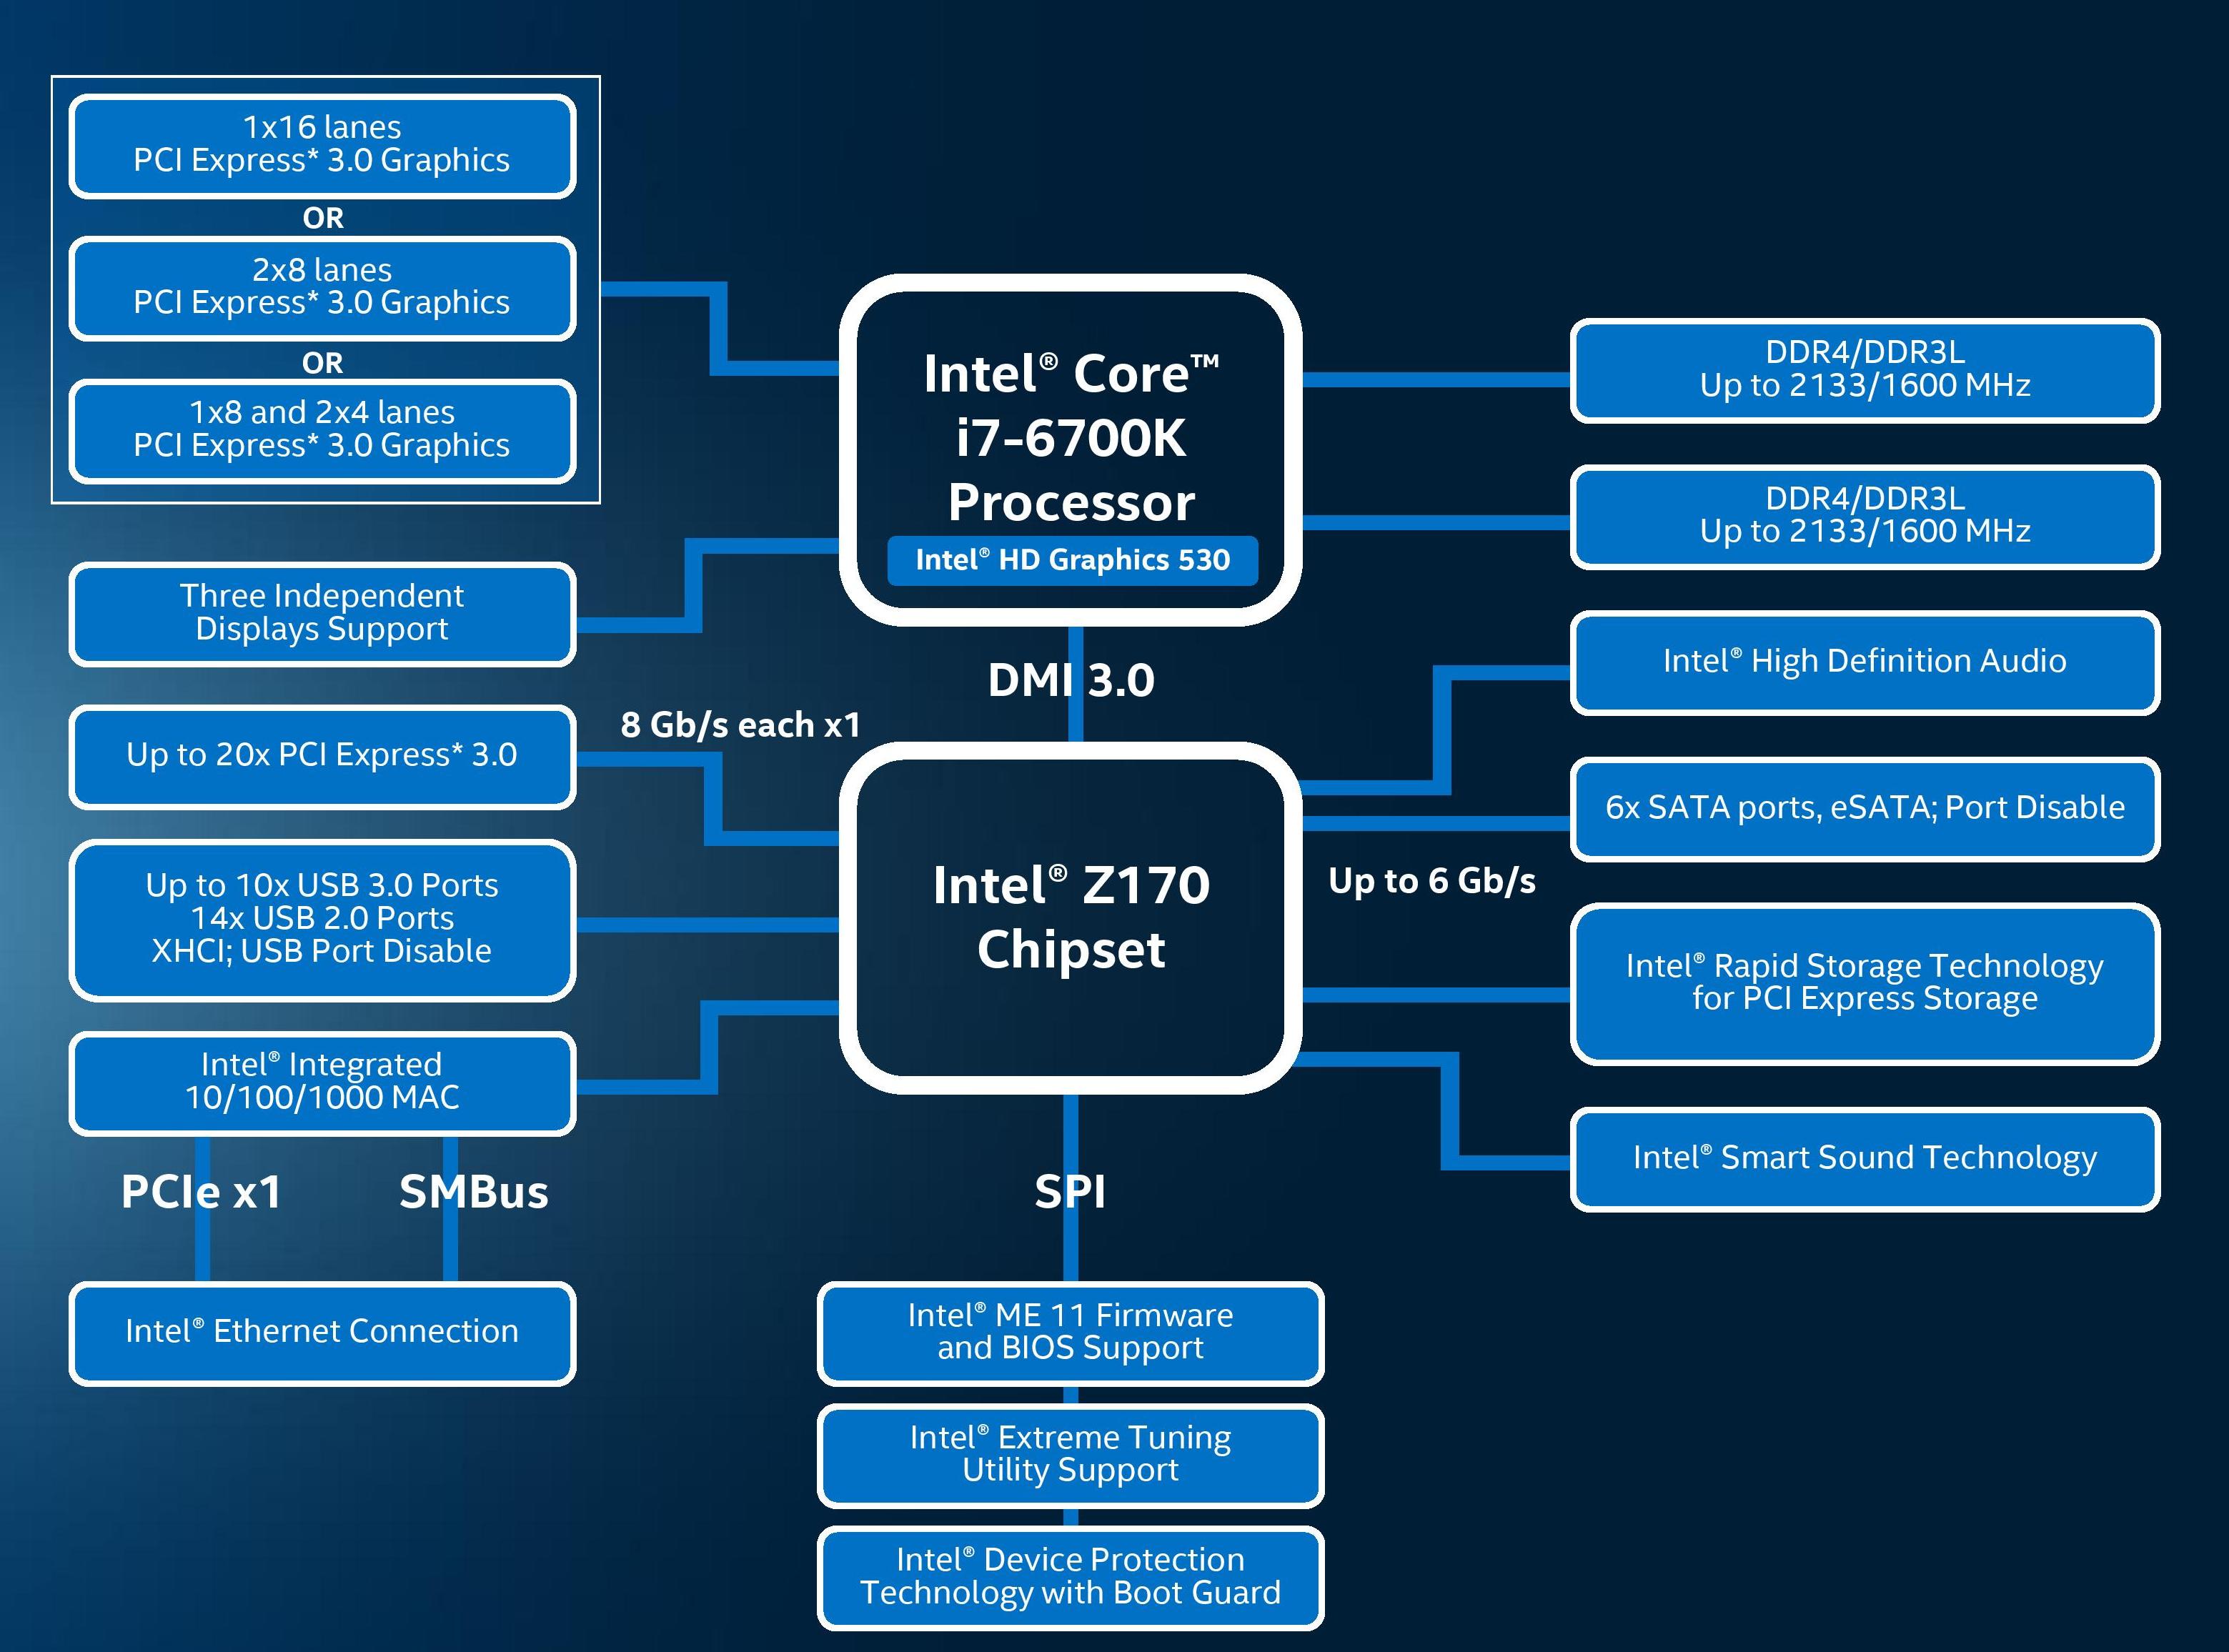
From a CPU connectivity standpoint, we discussed the DDR3L/DDR4 dual memory controller design on the previous page so we won’t go over it again here. On the PCI-Express Graphics allocation side, the Skylake processors will have sixteen PCIe 3.0 lanes to use for directly attached devices to the processor, similar to Intel's previous generation processors. These can be split into a single PCIe 3.0 x16, x8/x8 or x8/x4/x4 with basic motherboard design. (Note that this is different to early reports of Skylake having 20 PCIe 3.0 lanes for GPUs. It does not.)
With this, SLI will work up to x8/x8. If a motherboard supports x8/x4/x4 and a PCIe card is placed into that bottom slot, SLI will not work because only one GPU will have eight lanes. NVIDIA requires a minimum of PCIe x8 in order to enable SLI. Crossfire has no such limitation, which makes the possible configurations interesting. Below we discuss that the chipset has 20 (!) PCIe 3.0 lanes to use in five sets of four lanes, and these could be used for graphics cards as well. That means a motherboard can support x8/x8 from the CPU and PCIe 3.0 x4 from the chipset and end up with either dual-SLI or tri-CFX enabled when all the slots are populated.
DMI 3.0
The processor is connected to the chipset by the four-lane DMI 3.0 interface. The DMI 3.0 protocol is an upgrade over the previous generation which used DMI 2.0 – this upgrade boosts the speed from 5.0 GT/s (2GB/sec) to 8.0 GT/s (~3.93GB/sec), essentially upgrading DMI from PCIe 2 to PCIe 3, but requires the motherboard traces between the CPU and chipset to be shorter (7 inches rather than 8 inches) in order to maintain signal speed and integrity. This also allows one of the biggest upgrades to the system, chipset connectivity, as shown below in the HSIO section.
CPU Power Arrangements
Moving on to power arrangements, with Skylake the situation changes as compared to Haswell. Prior to Haswell, voltage regulation was performed by the motherboard and the right voltages were then put into the processor. This was deemed inefficient for power consumption, and for the Haswell/Broadwell processors Intel decided to create a fully integrated voltage regulator (FIVR) in order to reduce motherboard cost and reduce power consumption. This had an unintended side-effect – while it was more efficient (good for mobile platforms), it also acted as a source of heat generation inside the CPU with high frequencies. As a result, overclocking was limited by temperatures and the quality of the FIVR led to a large variation in results. For Skylake on the desktop, the voltage regulation is moved back into the hands of the motherboard manufacturers. This should allow for cooler processors depending on how the silicon works, but it will result in slightly more expensive motherboards.
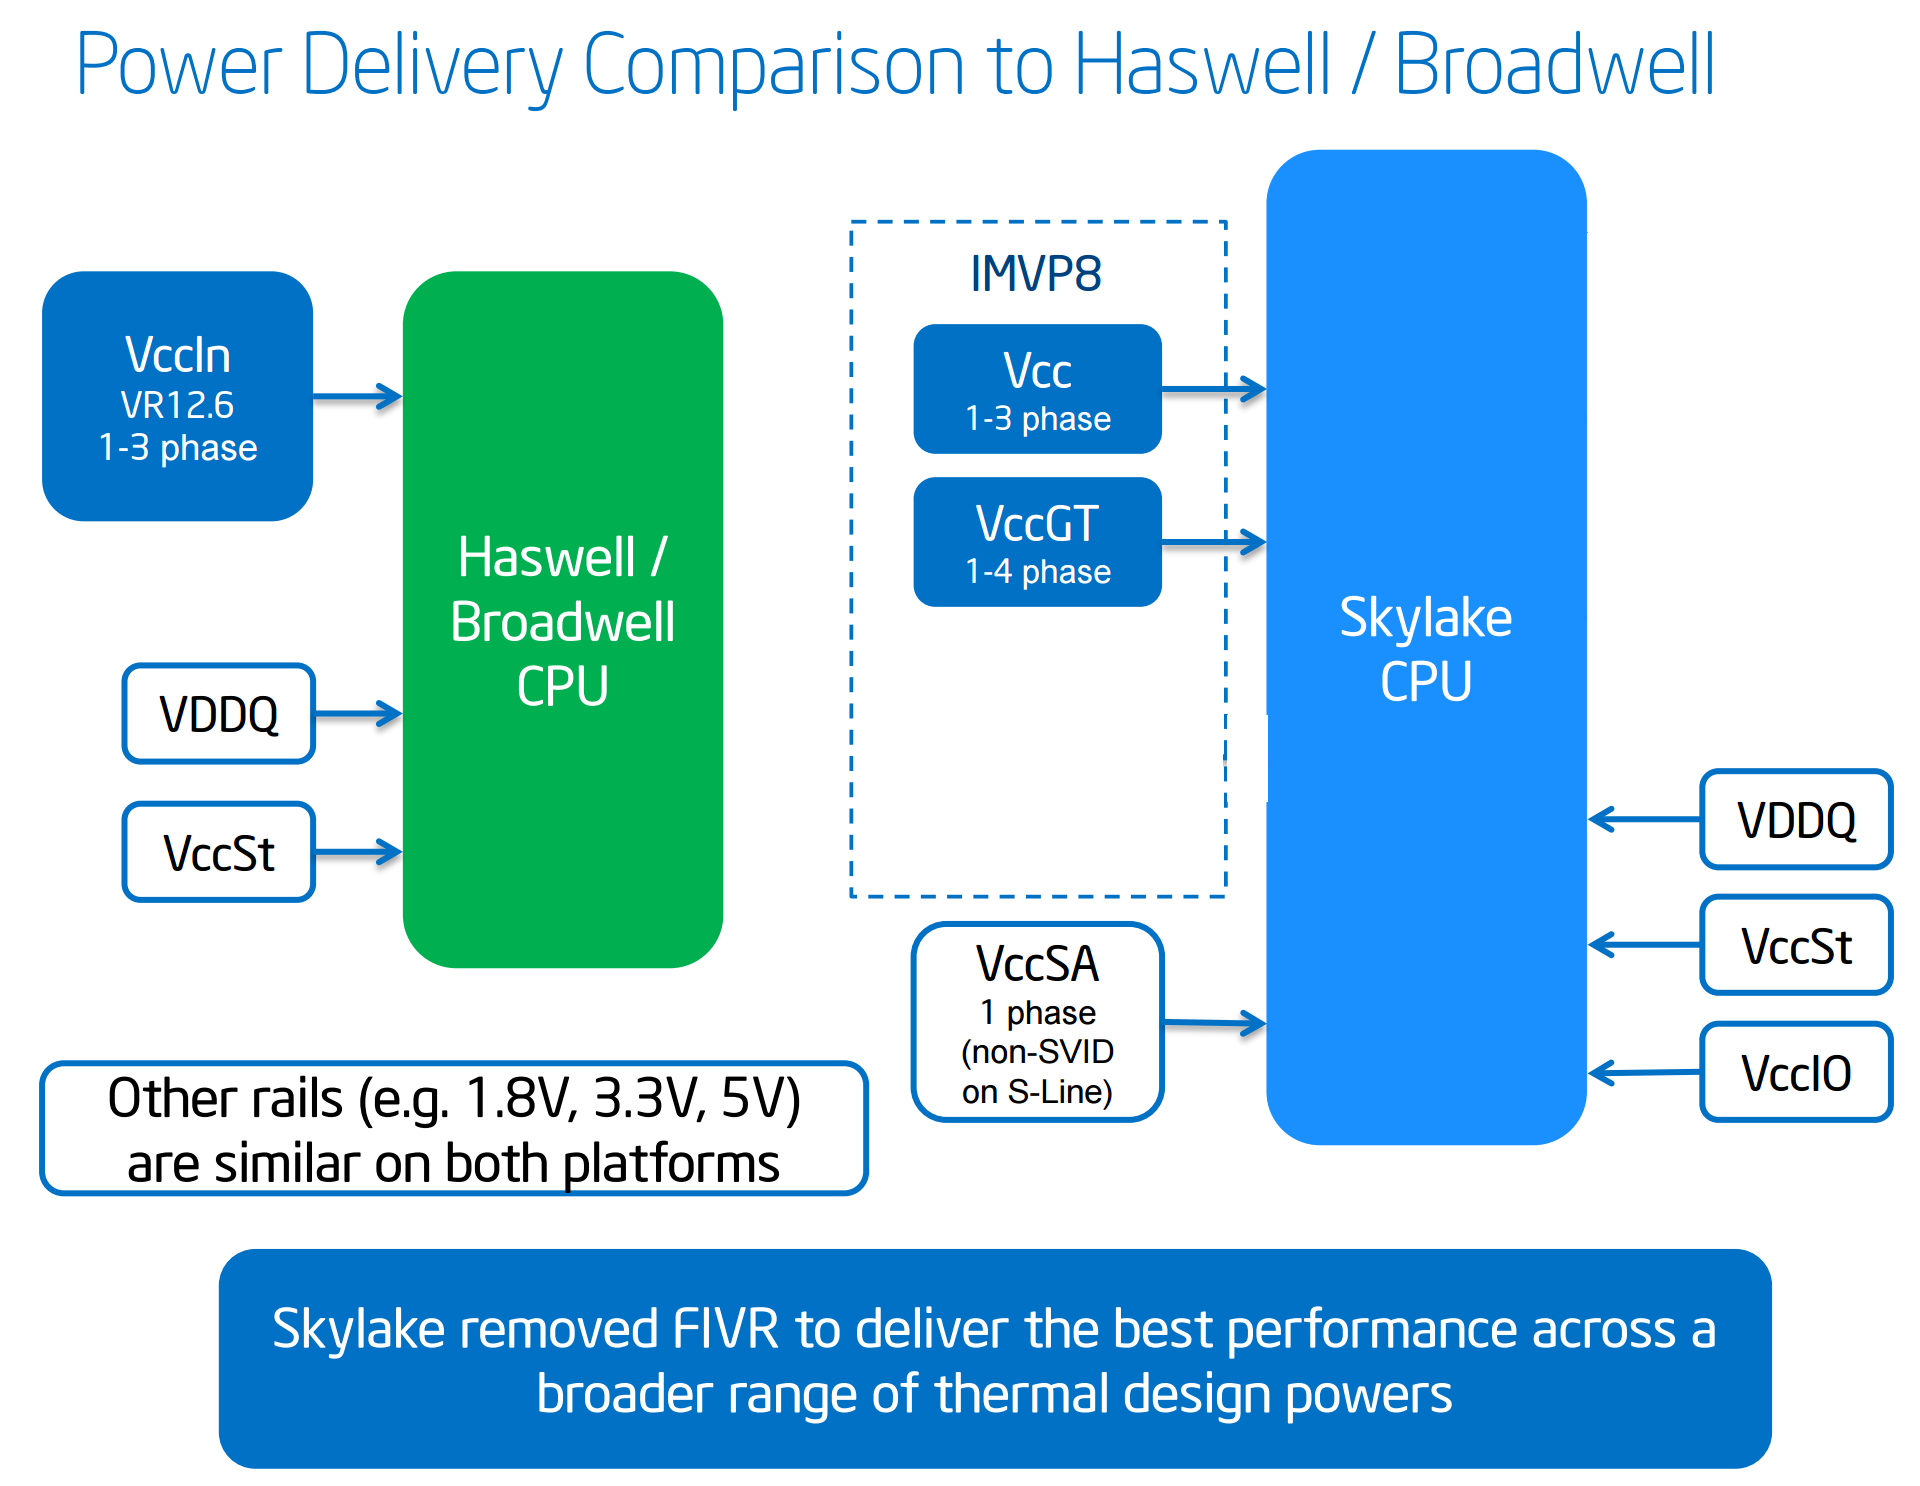
A slight indication of this will be that some motherboards will go back to having a large amount of multiplexed phases on the motherboard, and it will allow some manufacturers to use this as a differentiating point, although the usefulness of such a design is sometimes questionable.
Skylake's iGPU: Intel Gen9
Both the Skylake processors here use Intel’s HD 530 graphics solution. When I first heard the name, alarm bells went off in my head with questions: why is the name different, has the architecture changed, and what does this mean fundamentally?
Not coming up with many details, we did the obvious thing – check what information comes directly out of the processor. Querying HD 530 via Intel's OpenCL driver reports a 24 EU design running at 1150 MHz. This is different than what GPU-Z indicates, which points to a 48 EU design instead, although GPU-Z is not often correct on newer graphics modules before launch day. We can confirm that this is a 24 EU design, and this most likely follows on from Intel’s 8th Generation graphics in the sense that we have a base GT2 design featuring three sub-slices of 8 EUs each.
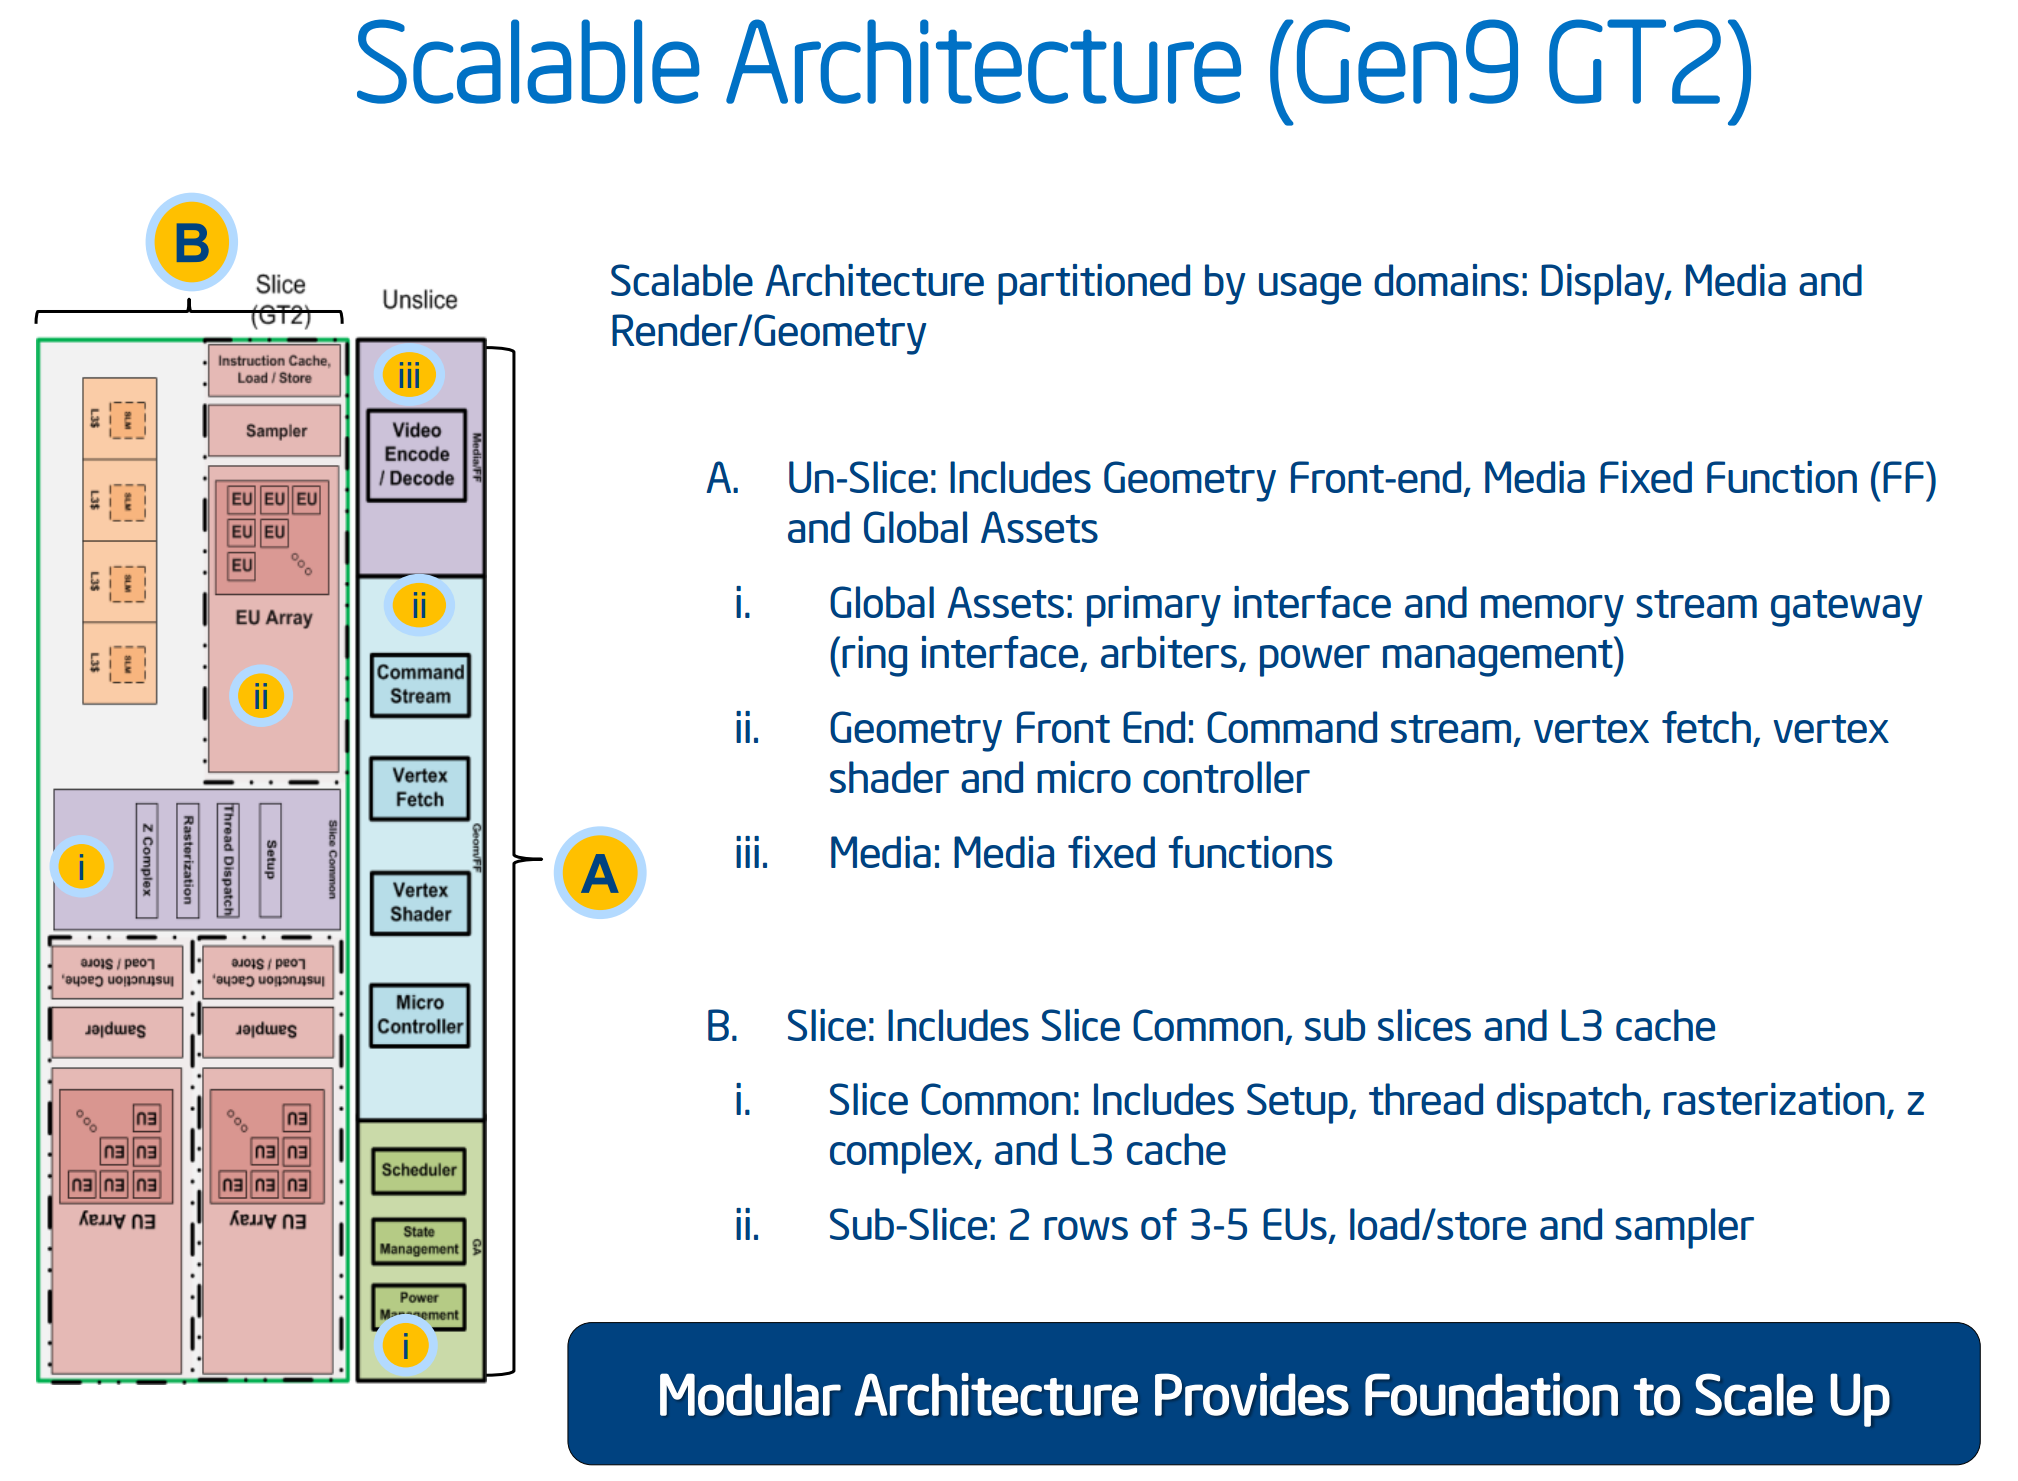
As far as we can tell, Intel calls the HD 530 graphics part of its 9th Generation (i.e. Gen9). We have been told directly by Intel that they have changed their graphics naming scheme from a four digit (e.g. HD4600) to a three digit (HD 530) arrangement in order "to minimize confusion" (direct quote). Personally we find that it adds more confusion, because the HD 4600 naming is not directly linked to the HD 530 naming. While you could argue that 5 is more than 4, but we already have HD 5200, HD 5500, Iris 6100 and others. So which is better, HD 530 or HD 5200? At this point it will already create a miasma of uncertainty, probably exaggerated until we get a definite explanation of the stack nomenclature.
Naming aside, Generation 9 graphics comes with some interesting enhancements. The slice and un-slice now have individual power and clock domains, allowing for a more efficient use of resources depending on the load (e.g. some un-slice not needed for some compute tasks). This lets the iGPU better balance power usage between fixed-function operation and programmable shaders.
Generation 9 will support a feature called Multi Plane Overlay, which is a similar feature to AMD’s video playback path adjustments in Carrizo. The principle here is that when a 3D engine has to perform certain operations to an image (blend, resize, scale), the data has to travel from the processor into DRAM then to the GPU to be worked on, then back out to DRAM before it hits the display controller, a small but potentially inefficient operation in mobile environments. What Multi Plane Overlay does is add fixed function hardware to the display controller to perform this without ever hitting the GPU, minimizing power consumption from the GPU and taking out a good portion of DRAM data transfers. This comes at a slight hit for die area overall due to the added fixed function units.
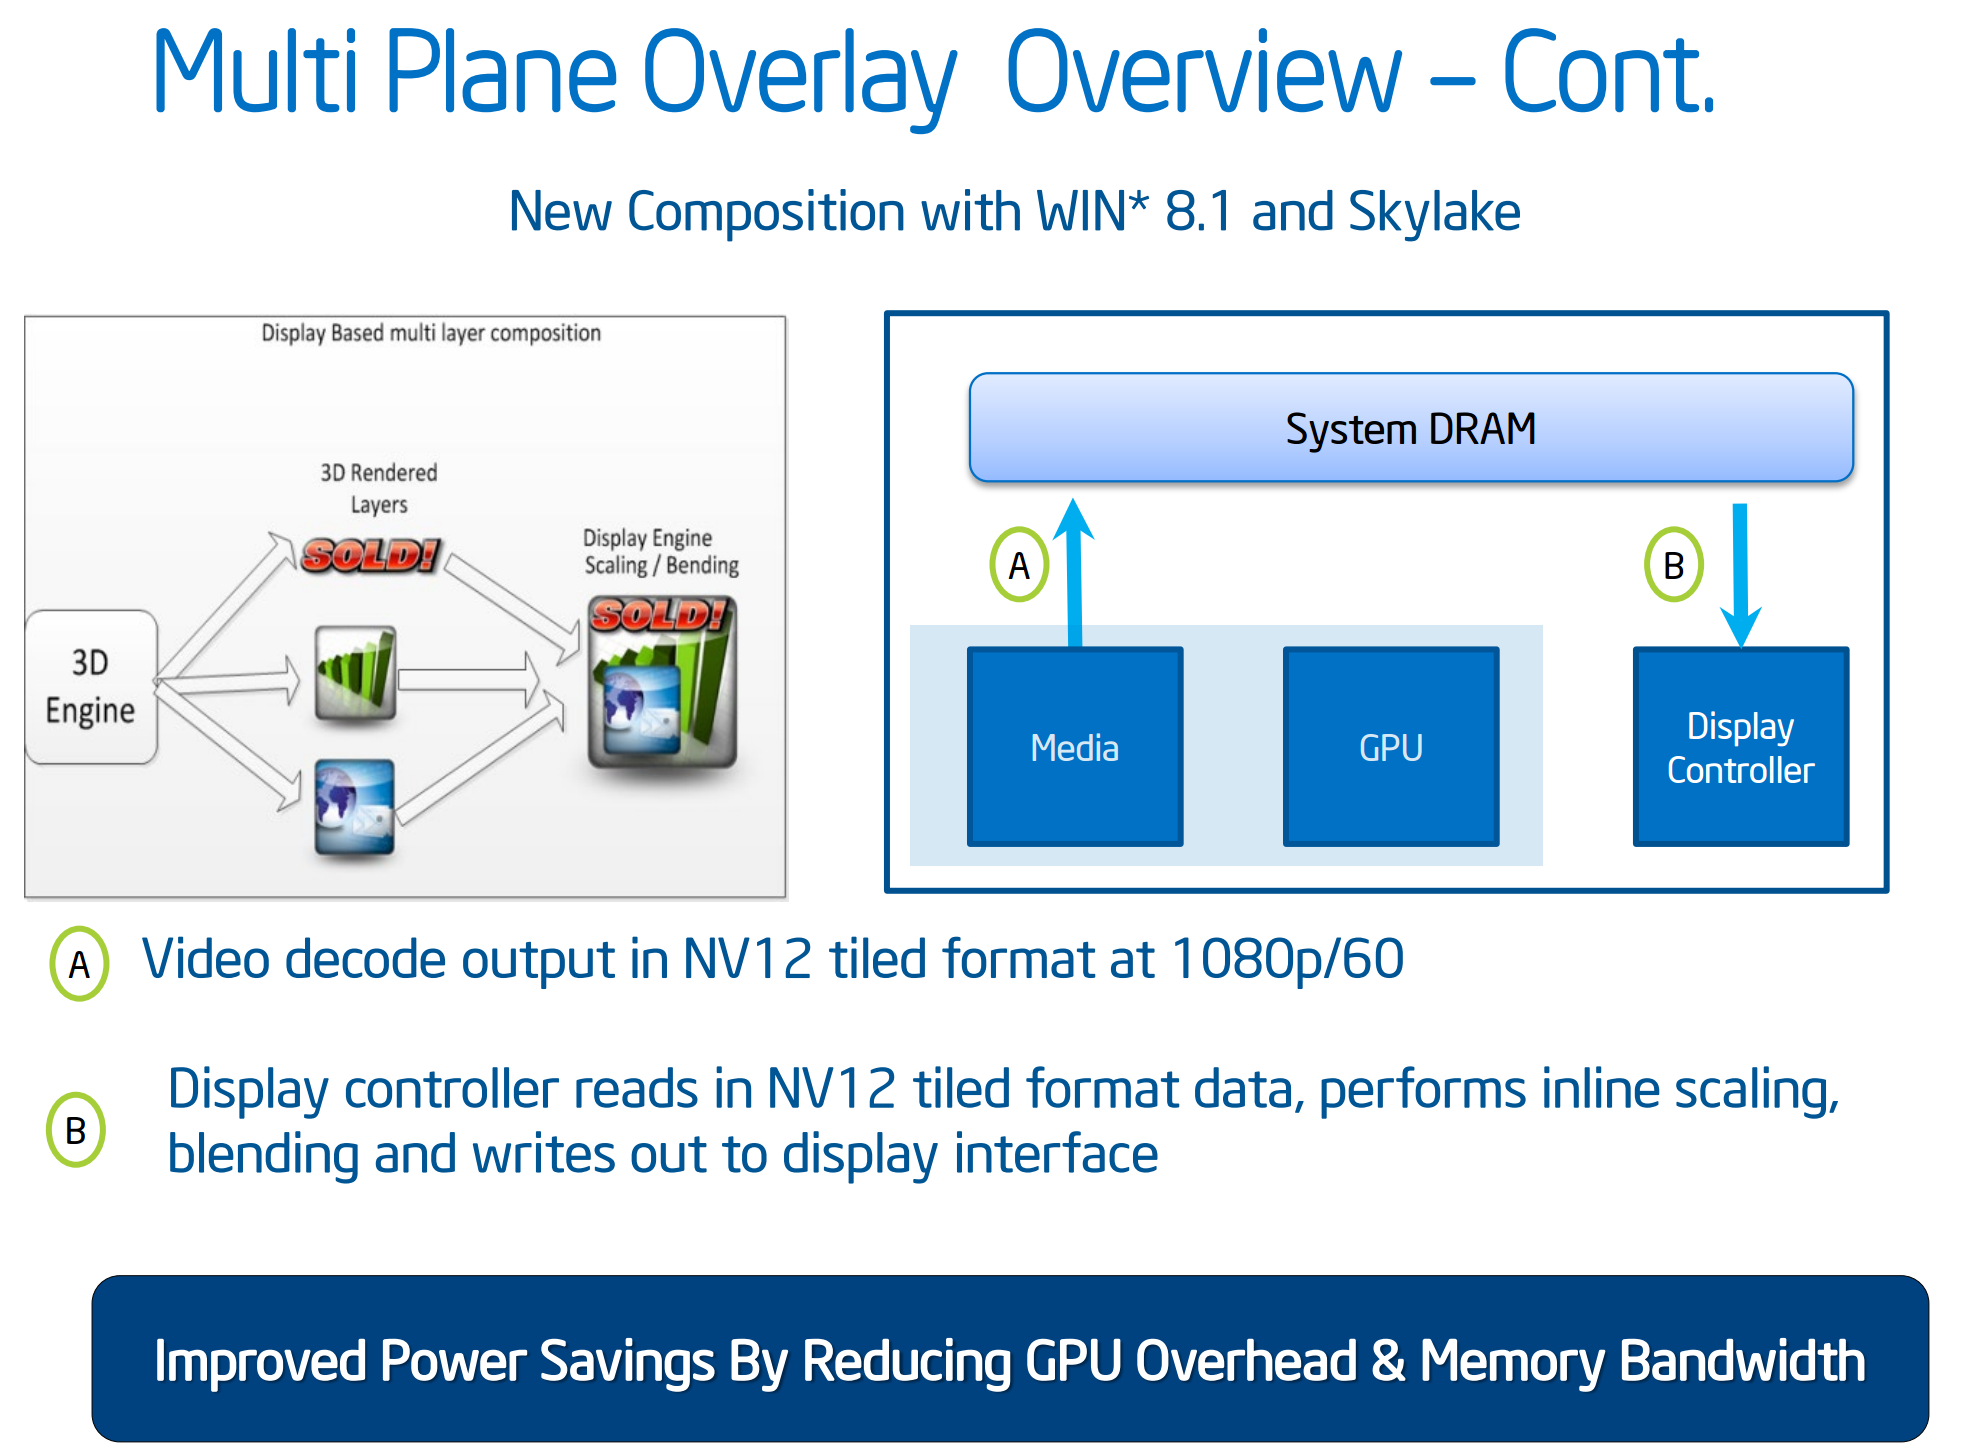
As shown above, this feature will be supported on Win 8.1 with Skylake’s integrated graphics. That being said, not all imaging can be moved in this way, but where possible the data will take the shorter path.
To go along with the reduced memory transfer, Gen9 has support for memory color stream compression. We have seen this technology come into play for other GPUs, where by virtue of fixed function hardware and lossless algorithms this means that smaller quantities of image and texture data is transferred around the system, again saving power and reducing bandwidth constraints. The memory compression is also used with a scalar and format conversion pipe to reduce the encoding pressure on the execution units, reducing power further.
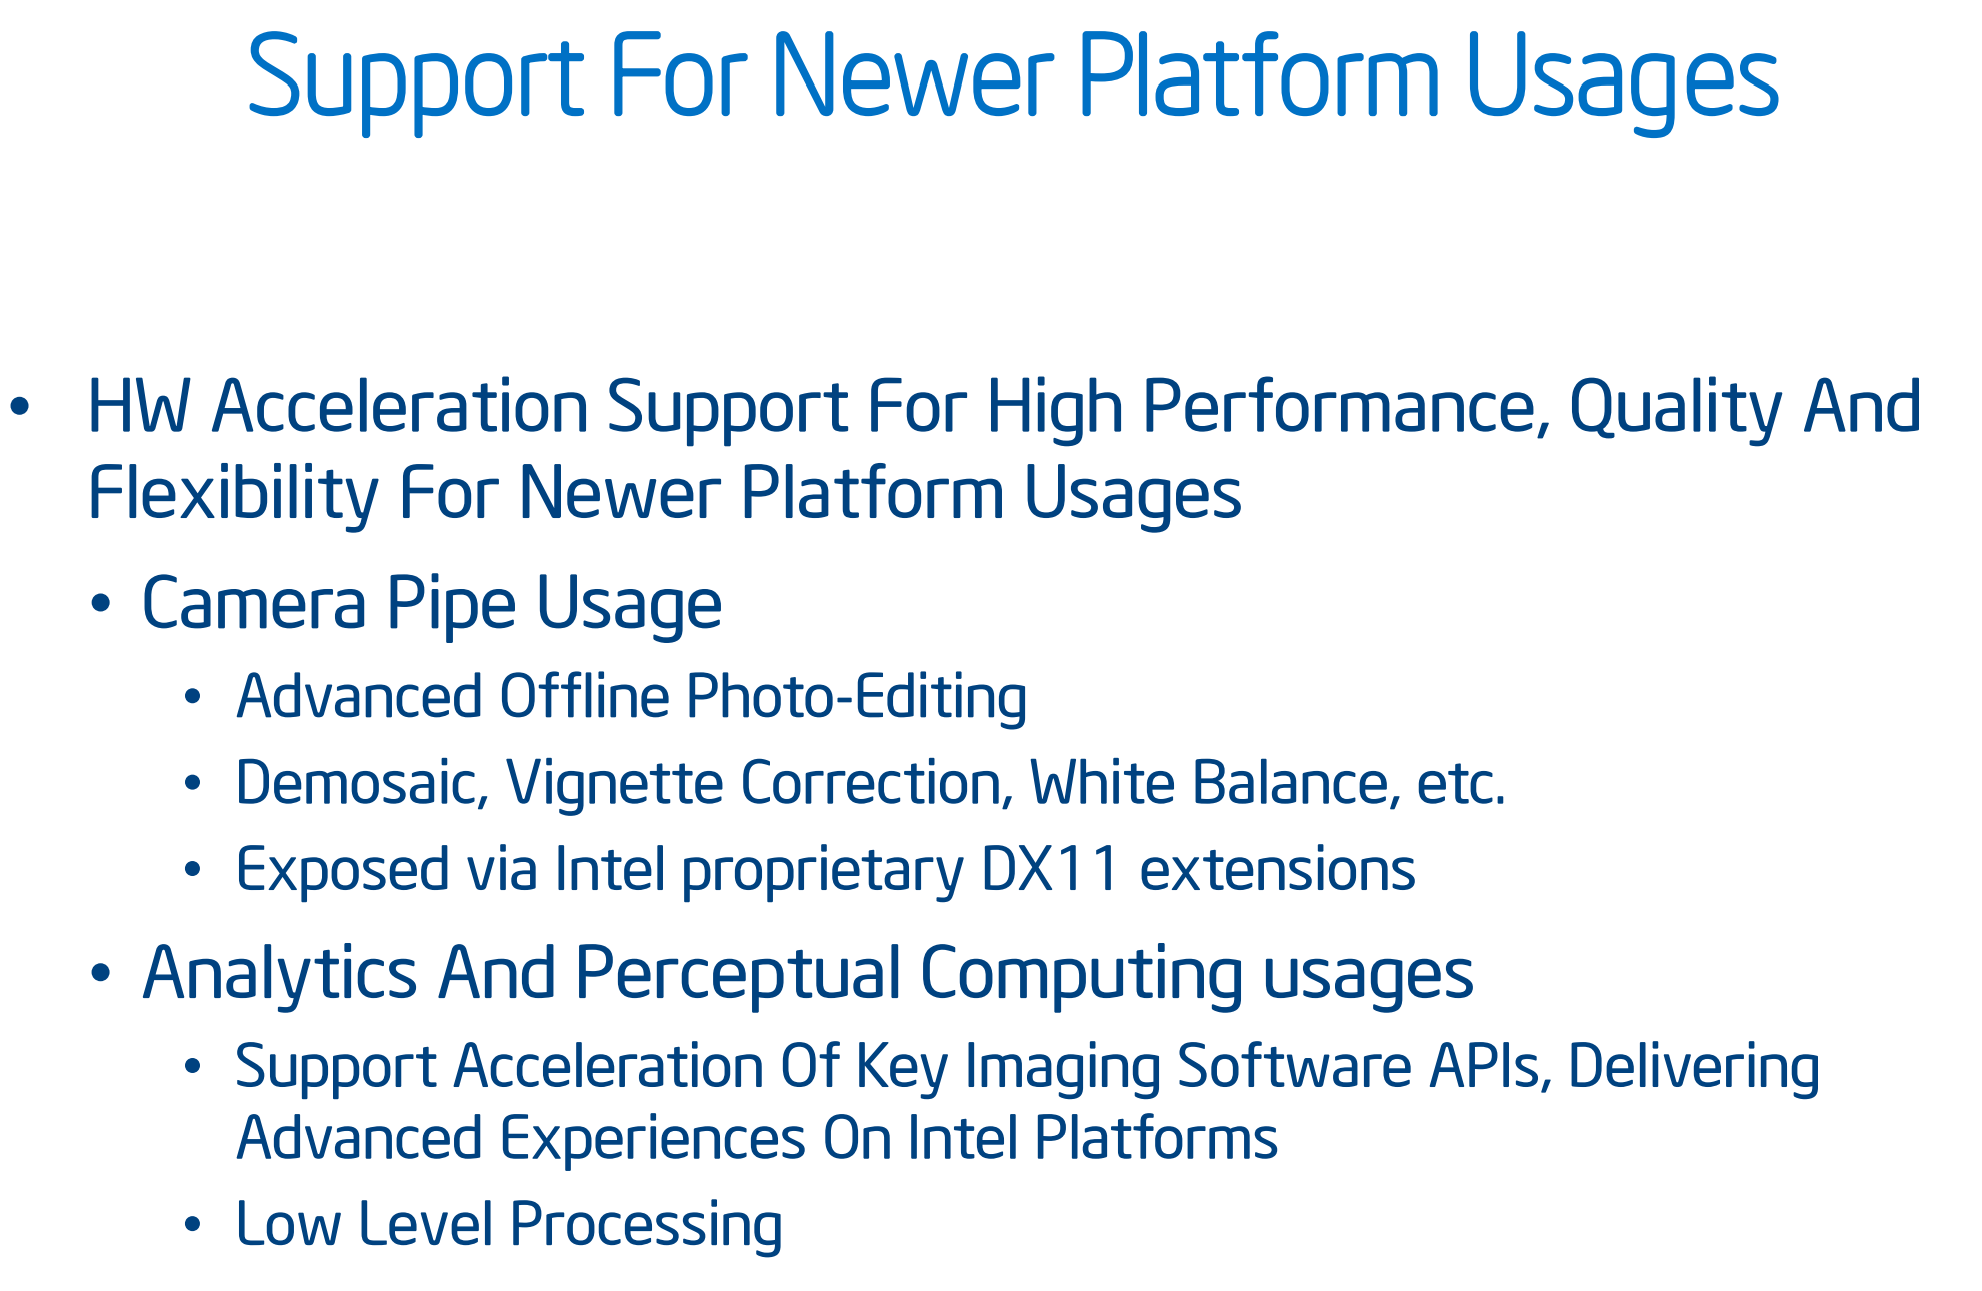
Adding into the mix, we have learned that Gen9 includes a feature called the ‘Camera Pipe’ for quick standard adjustments to images via hardware acceleration. This adjusts the programmable shaders to work in tandem for specific DX11 extensions on common image manipulation processes beyond resize/scale. The Camera Pipe is teamed with SDKs to help developers connect into optimized imaging APIs.
Media Encoding & Decoding
In the world of encode/decode, we get the following:
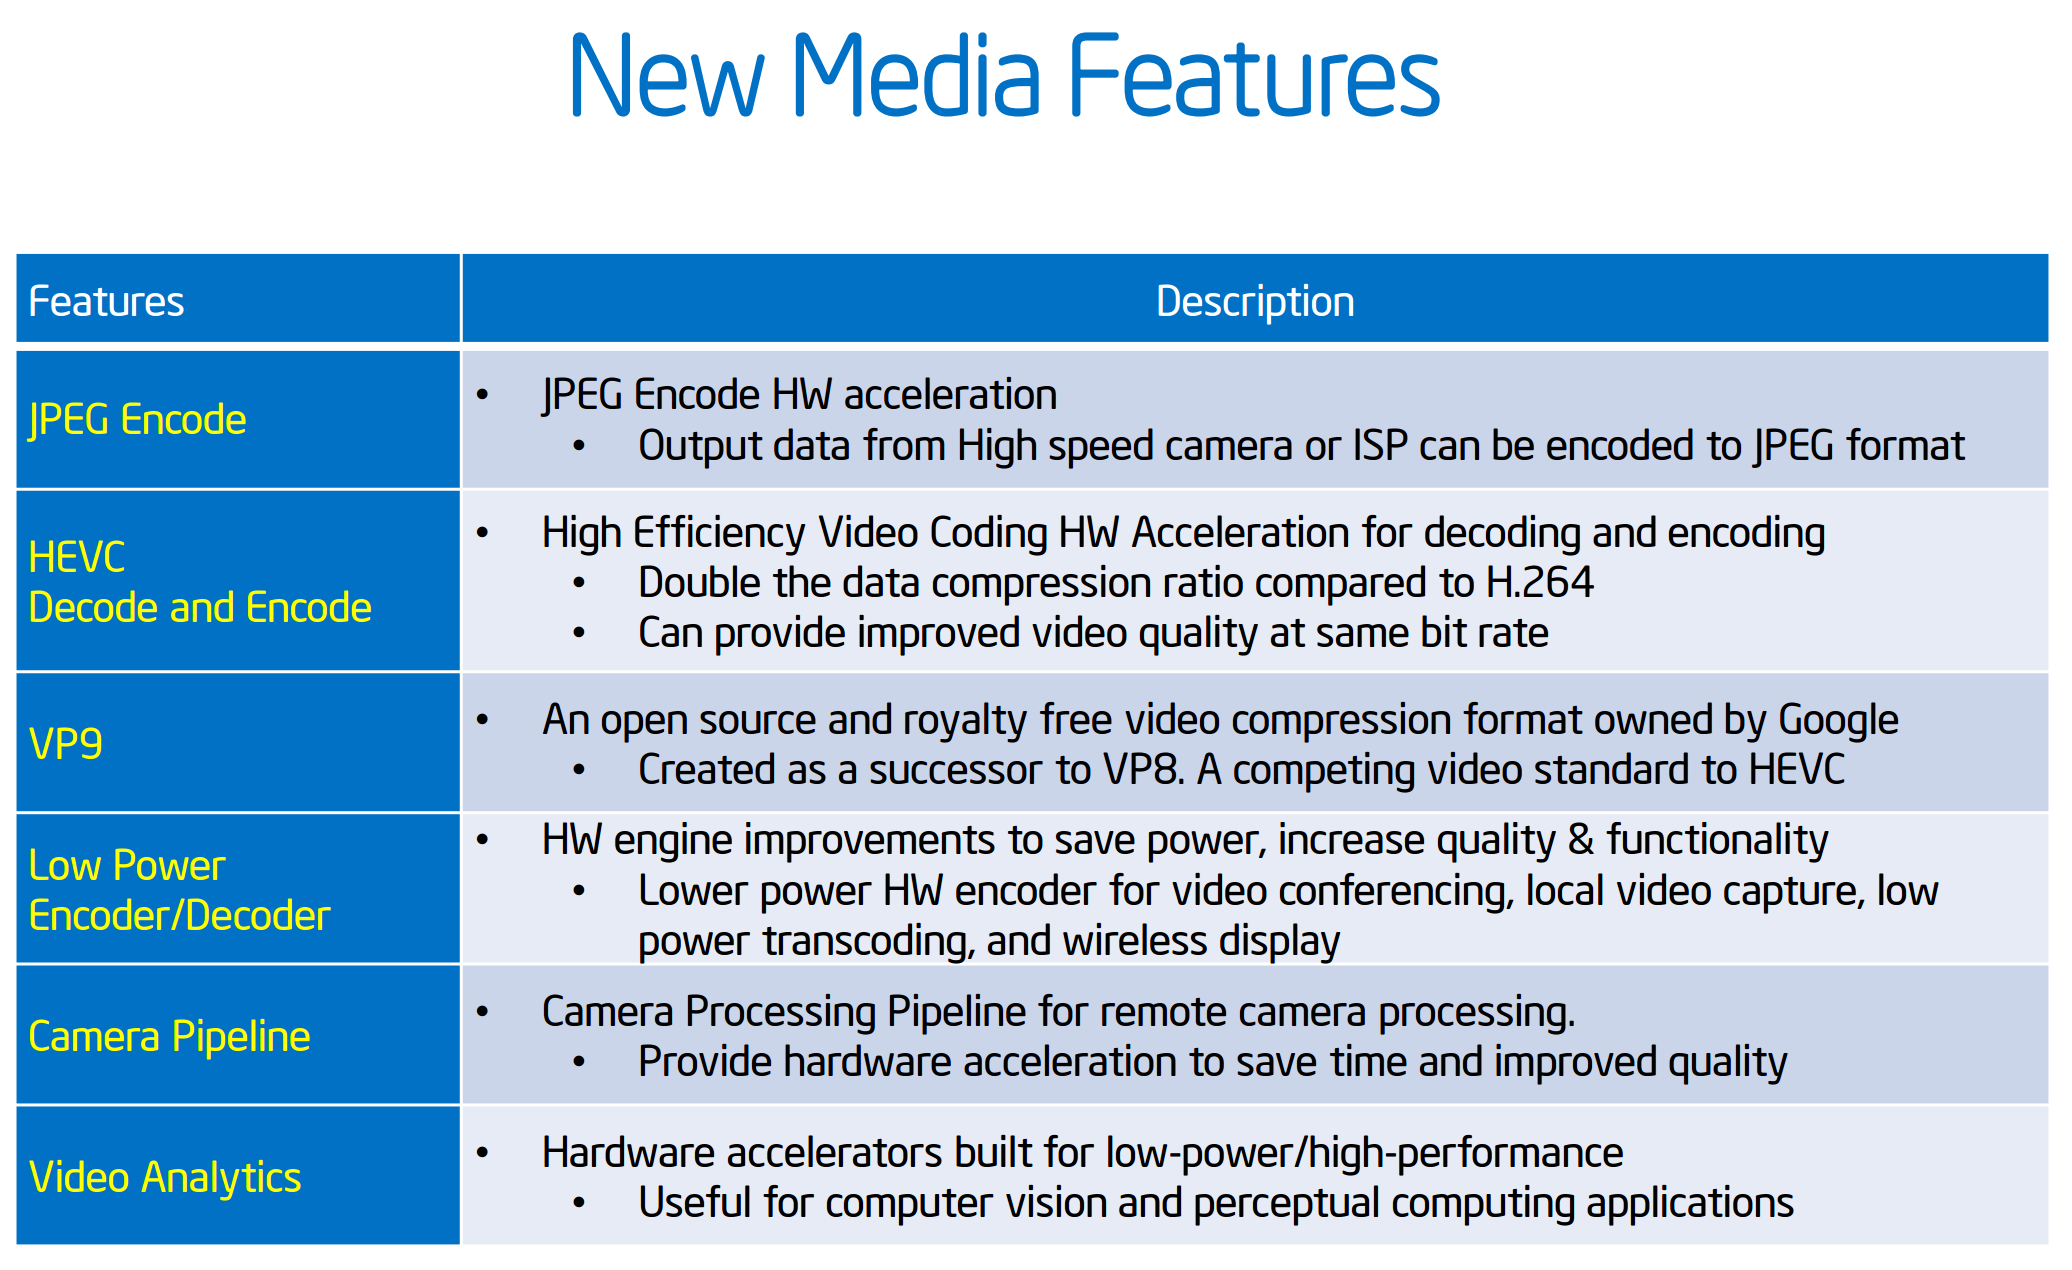
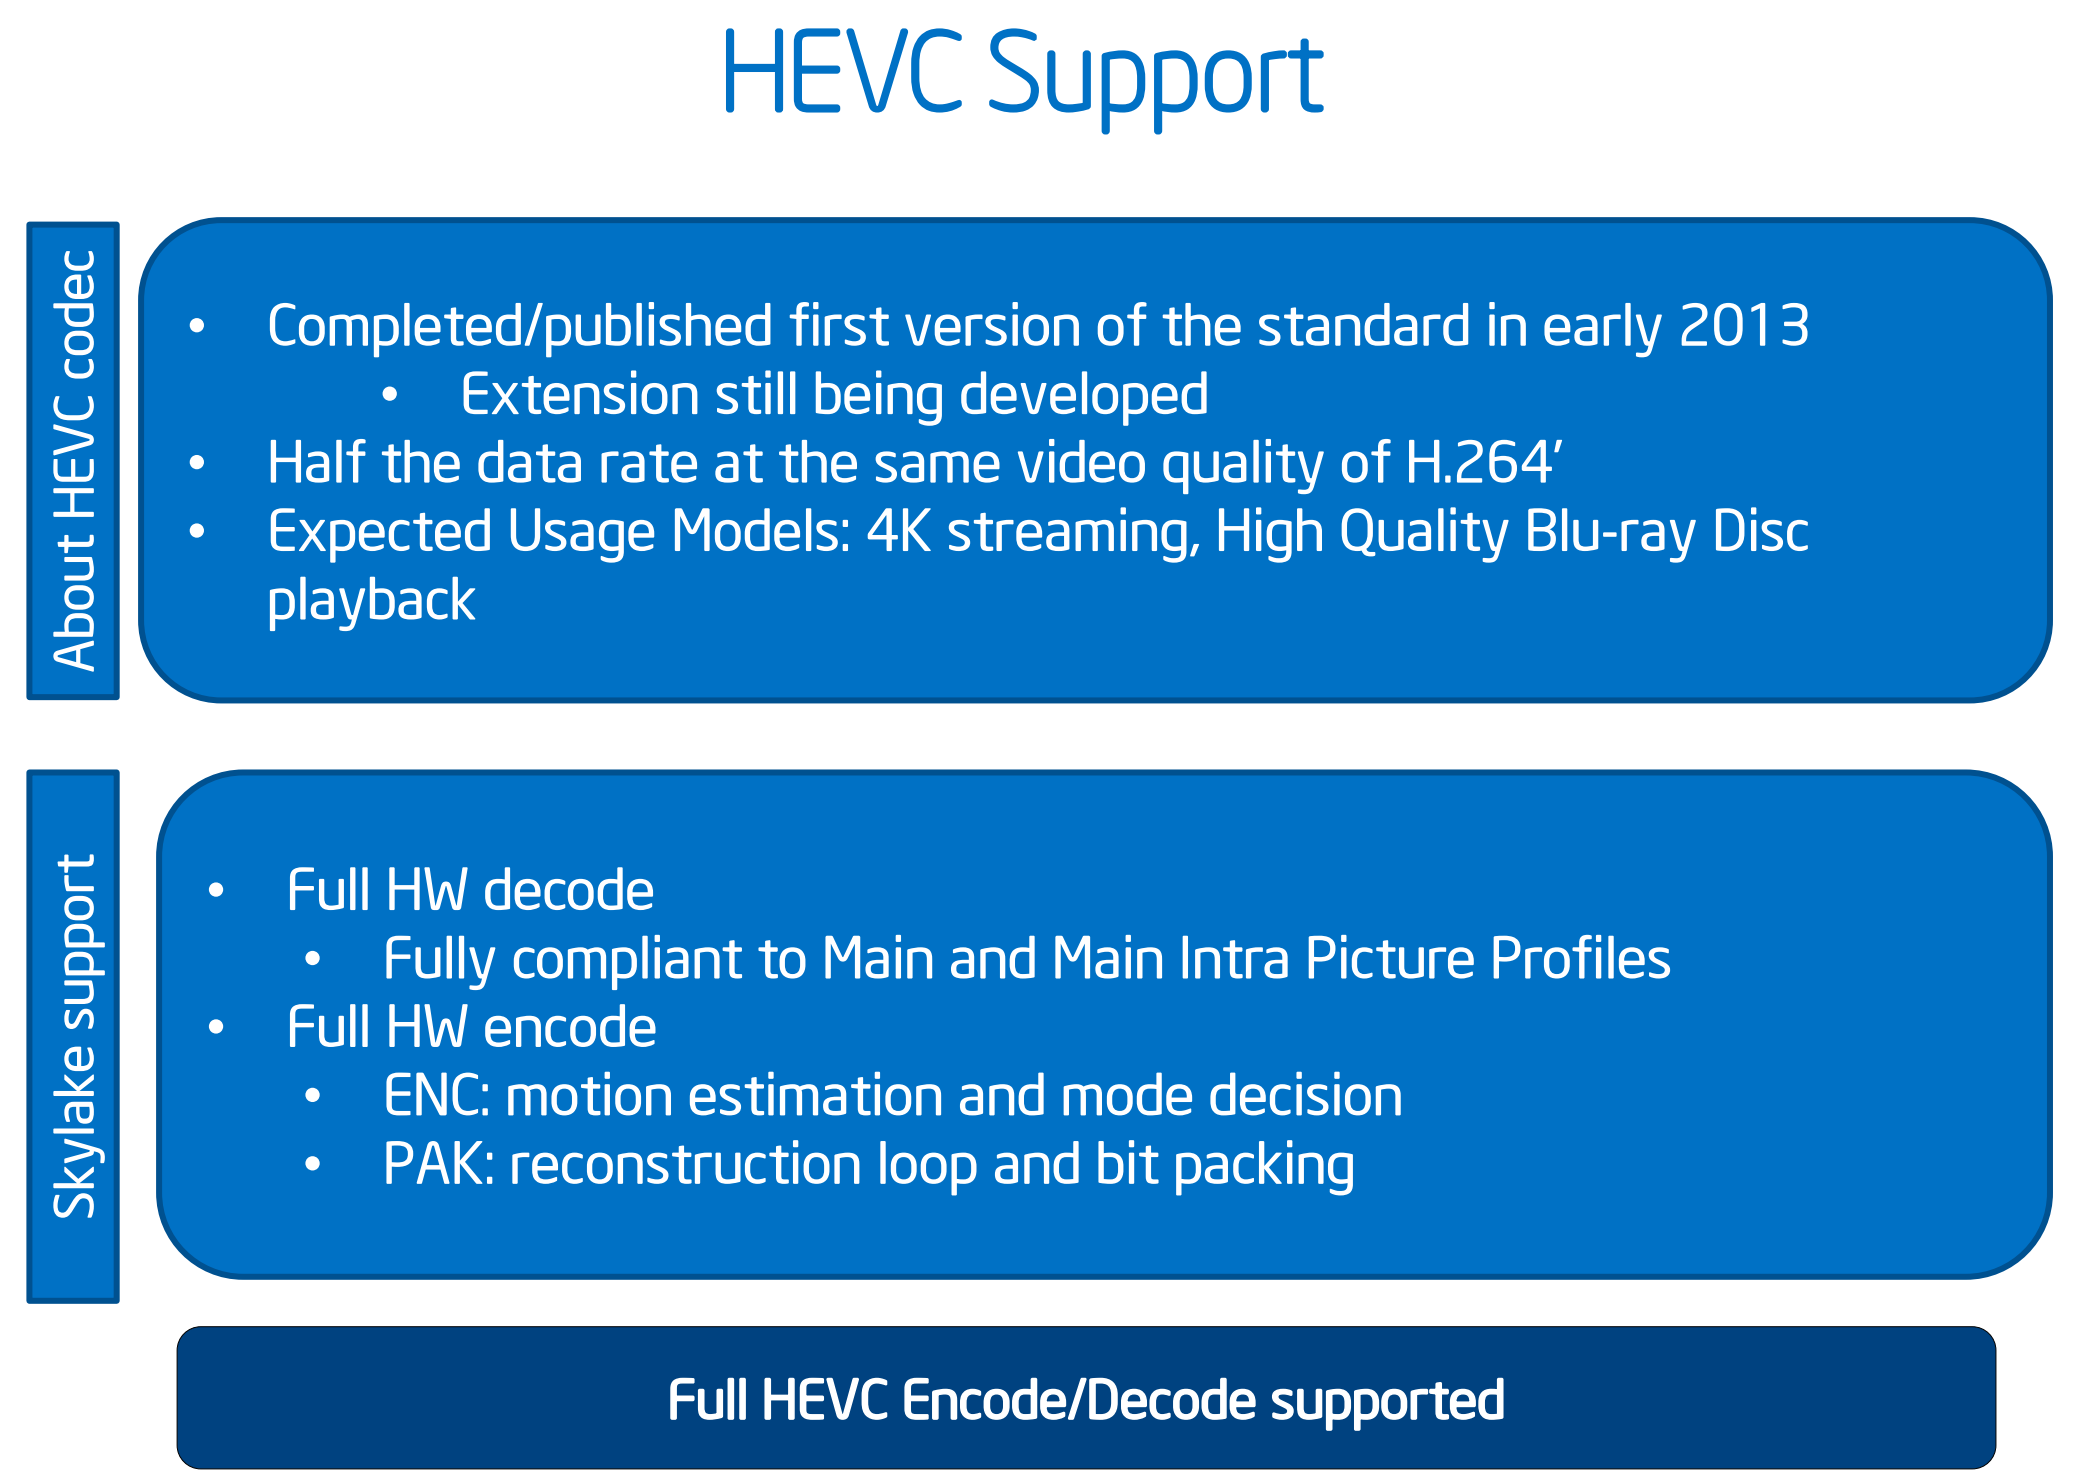
Whereas Broadwell implemented HEVC decoding in a "hybrid" fashion using a combination of CPU resources, GPU shaders, and existing GPU video decode blocks, Skylake gets a full, low power fixed function HEVC decoder. For desktop users this shouldn't impact things by too much - maybe improve compatibility a tad - but for mobile platforms this should significantly cut down on the amount of power consumed by HEVC decoding and increase the size and bitrate that the CPU can decode. Going hand-in-hand with HEVC decoding, HEVC encoding is now also an option with Intel's QuickSync encoder, allowing for quicker HEVC transcoding, or more likely real-time HEVC uses such as video conferencing.
Intel is also hedging their bets on HEVC by also implementing a degree of VP9 support on Skylake. VP9 is Google's HEVC alternative codec, with the company pushing it as a royalty-free option. Intel calls VP9 support on Skylake "partial" for both encoding and decoding, indicating that VP9 is likely being handled in a hybrid manner similar to how HEVC was handled on Broadwell.
Finally, JPEG encoding is new for Skylake and set to support images up to 16K*16K.
Video Support
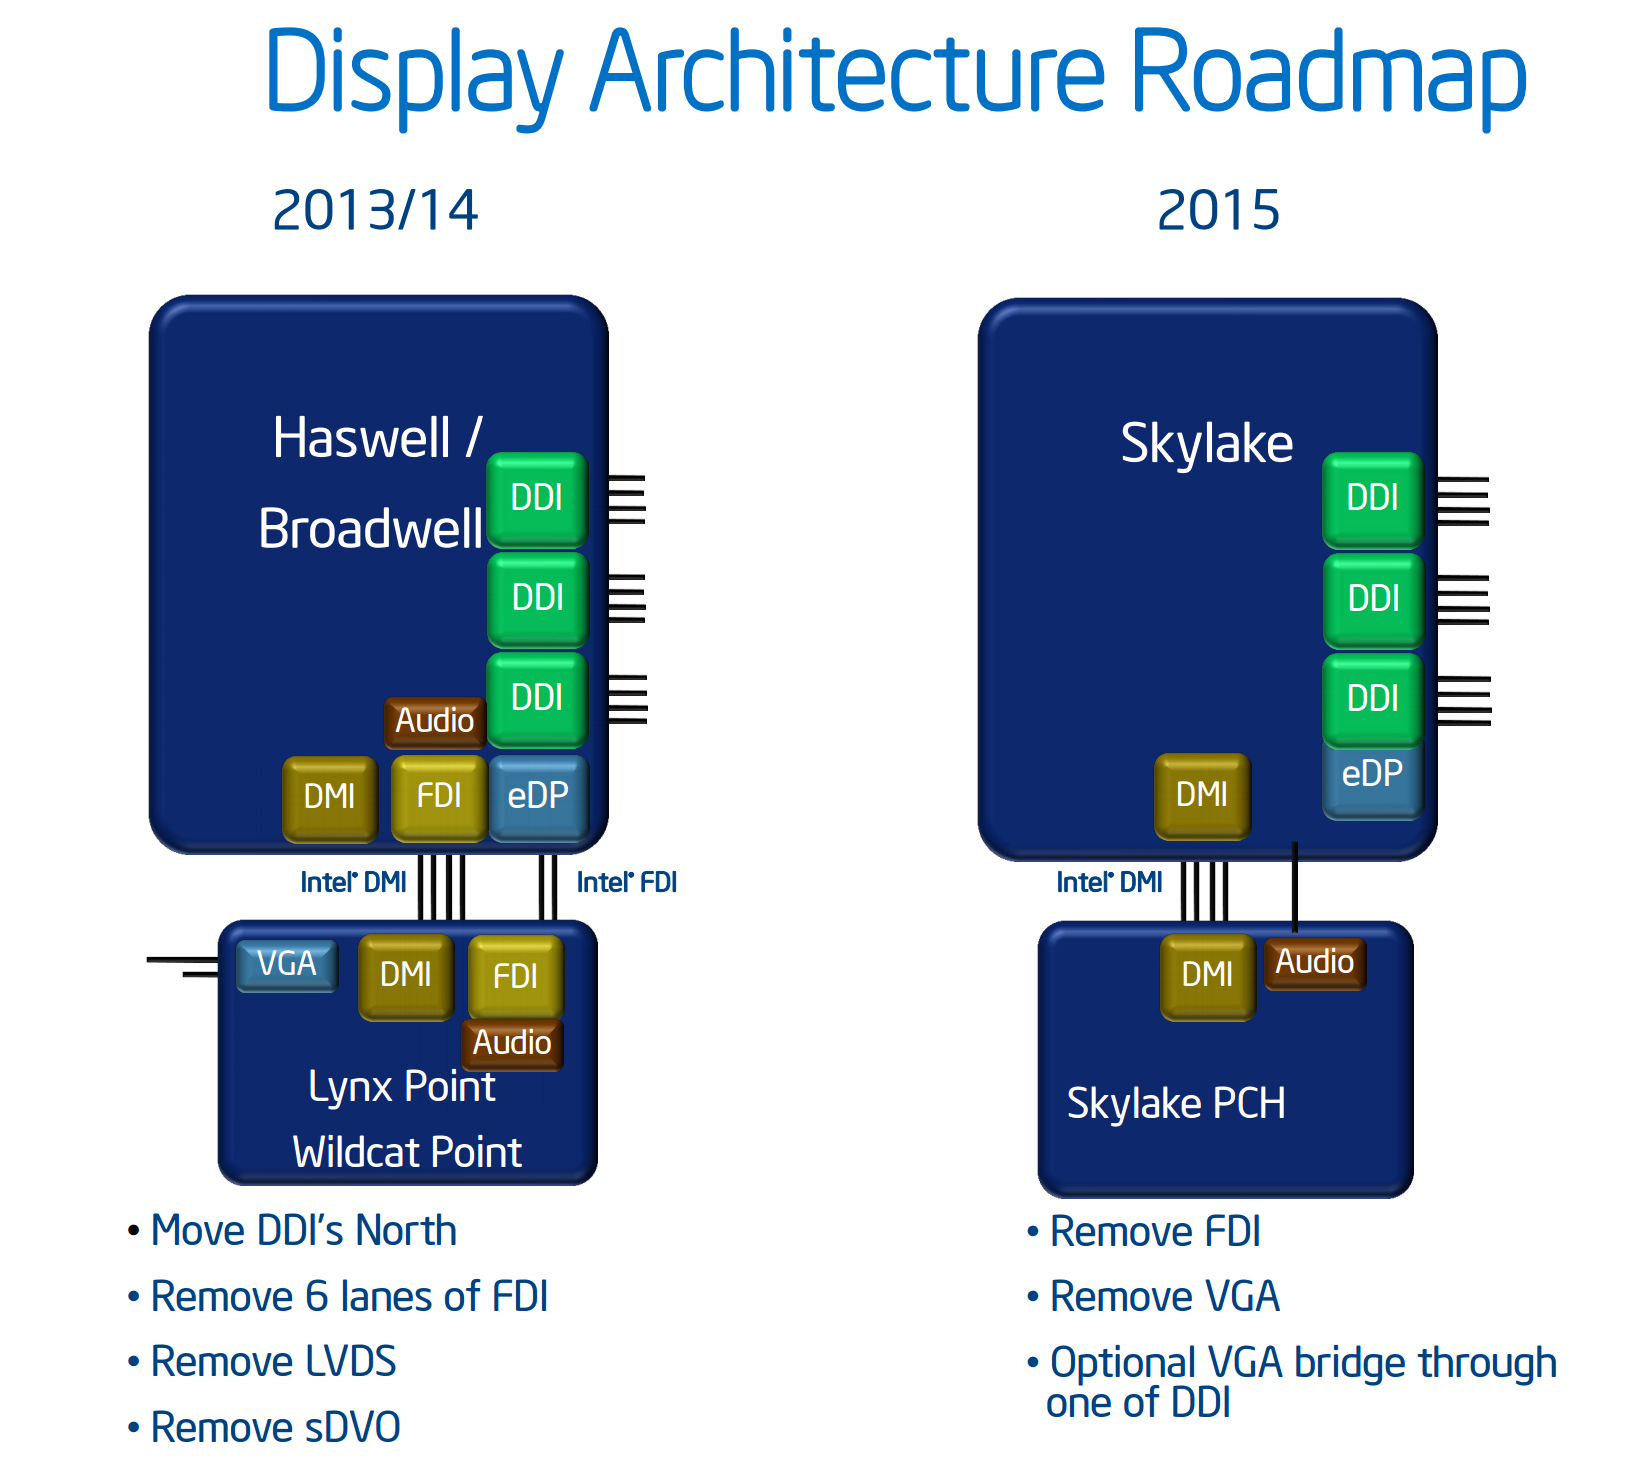
The analog (VGA) video connector has now been completely removed from the CPU/chipset combination, meaning that any VGA/D-Sub video connection has to be provided via an active digital/analog converter chip. This has been a long time coming, and is part of a previous committment made by Intel several years ago to remove VGA by 2015. Removing analog display functionality will mean added cost for legacy support in order to drive analog displays. Arguably this doesn’t mean much for Z170 as the high end platform is typically used with a discrete graphics card that has HDMI or DisplayPort, but we will see motherboards with VGA equipped in order to satisfy some regional markets with specific requirements.
HDMI 2.0 is not supported by default, and only the following resolutions are possible on the three digital display controllers:
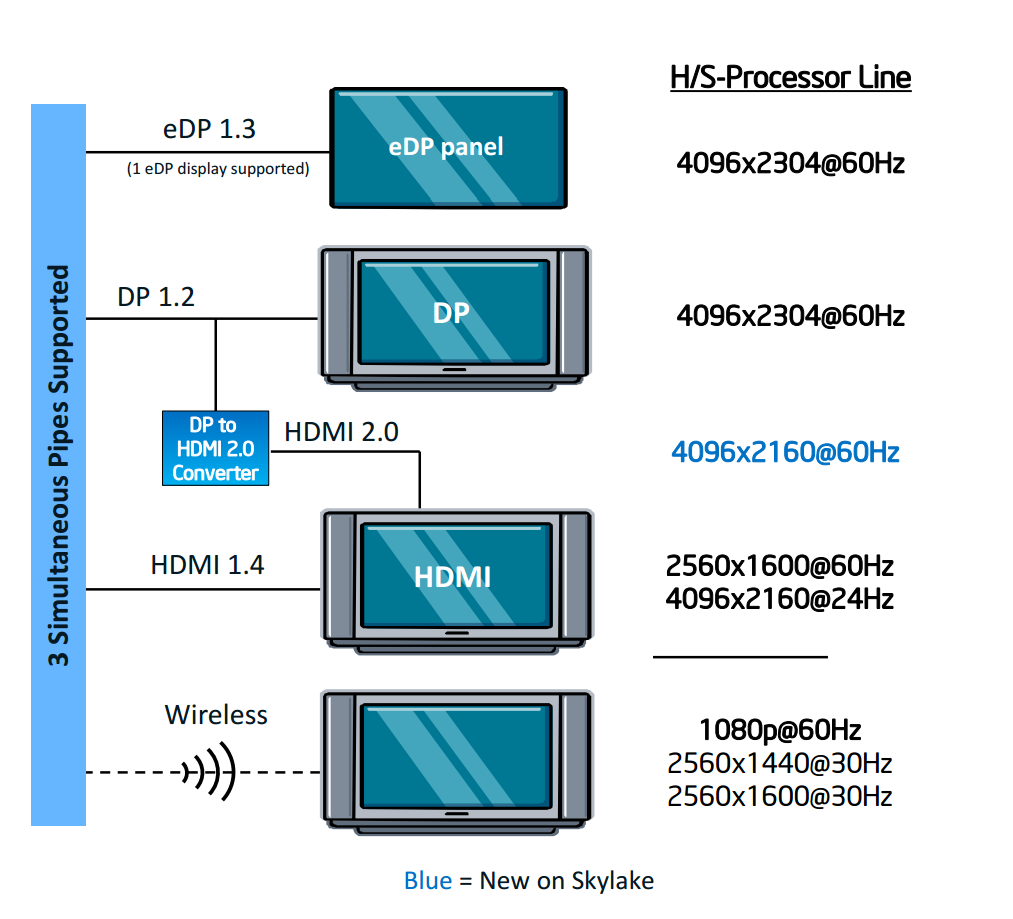
A DP to HDMI 2.0 converter, specifically an LS-Pcon, is required to do the adjustments, be it on the motherboard itself or as an external adapter. We suspect that there will not be many takers buying a controller to do this, given the capabilities and added benefits listed by the Alpine Ridge controller.
Skylake's Launch Chipset: Z170
Parts of this section are mirrored in our separate motherboard overview.
For our discussion of the chipset, I want to refer back to the block diagram for the platform:
26 High Speed IO Lanes (20x PCIe 3.0)
The Z170 chipset features a massive Flex-IO hub, known as HSIO. In the previous Z97 chipset, there are a total of 18 Flex-IO ports that can flip between PCIe lanes, USB 3.0 ports or SATA 6 Gbps ports. For Z170, this moves up to 26 and can be used in a variety of configurations:
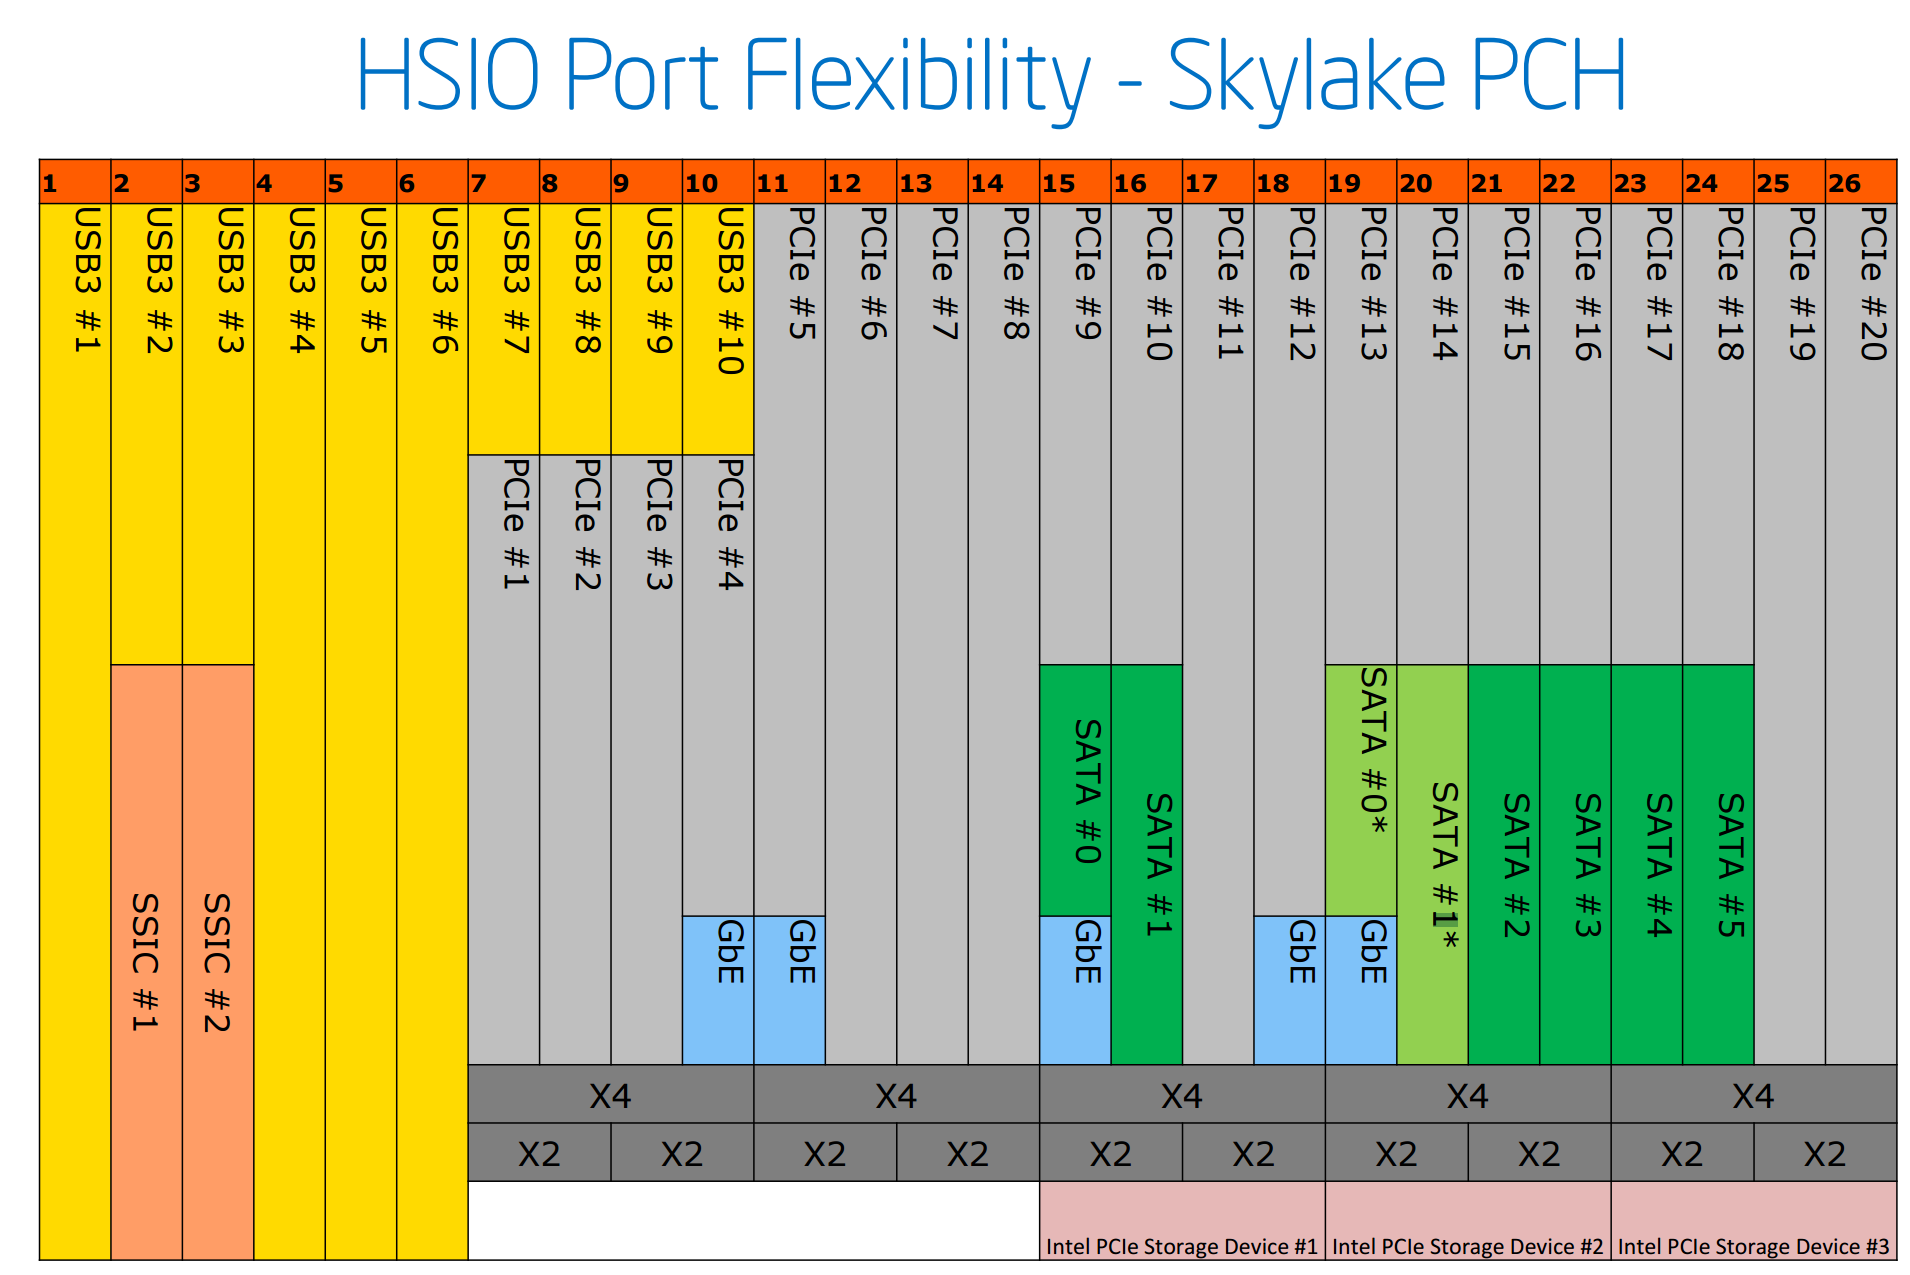
For each of the 26 high-speed input/output ports (HSIO, or the Flex-IO), there can be a variety of combinations available. Each manufacturer can run down the list and apply what they may or may not need – some of the extra functionality (e.g. GbE / Ethernet) will require extra controllers. By default, the first six HSIO ports are USB 3.0, with two able for super-speed interconnects where warranted. The next 20 HSIO ports are split into groups of four PCIe 3.0 lanes, such that each group is part of one of the internal controllers on the chipset.
The HSIO allows a smörgåsbord of options, a variable pick-and-mix. The last three sets of four are also labelled Intel PCIe storage device – this is important because the new Z170 chipset now supports more PCIe devices as part of its Rapid Storage Technology (RST). This allows M.2 and SATA Express devices to be in RAID arrays as long as they are connected through these HSIO lanes. The new version of RST is given the number 14, and RST 14 supports three PCIe devices at one time. As a result, we will probably see motherboards with three M.2 slots all in PCIe 3.0 x4 mode, available for RAID. With that being said, we lose any extra SATA ports and have to rely on controllers elsewhere to do everything else. It is worth noting that the constant SATA ports on Z170 support DEVSLP modes.
Companion Controllers For Z170 – Alpine Ridge, ASM1142, I219 for Network
There will be several companion controllers to look out for on the Z170 motherboards. The most common we expect to see is the ASMedia ASM1142 controller, which is used to provide USB 3.1 Gen 2 ports. This controller uses two PCIe lanes to provide up to two USB 3.1 ports, typically on the rear panel. We have reviewed this implementation on previous chipsets here and here. Typically the presence of the ASM1142 controller will increase the price of the motherboard by a small number of dollars – I suspect motherboard manufacturers are buying this in bulk for a number of future devices.
The other way to place USB 3.1 on the motherboard is through Intel’s Alpine Ridge Thunderbolt controller.
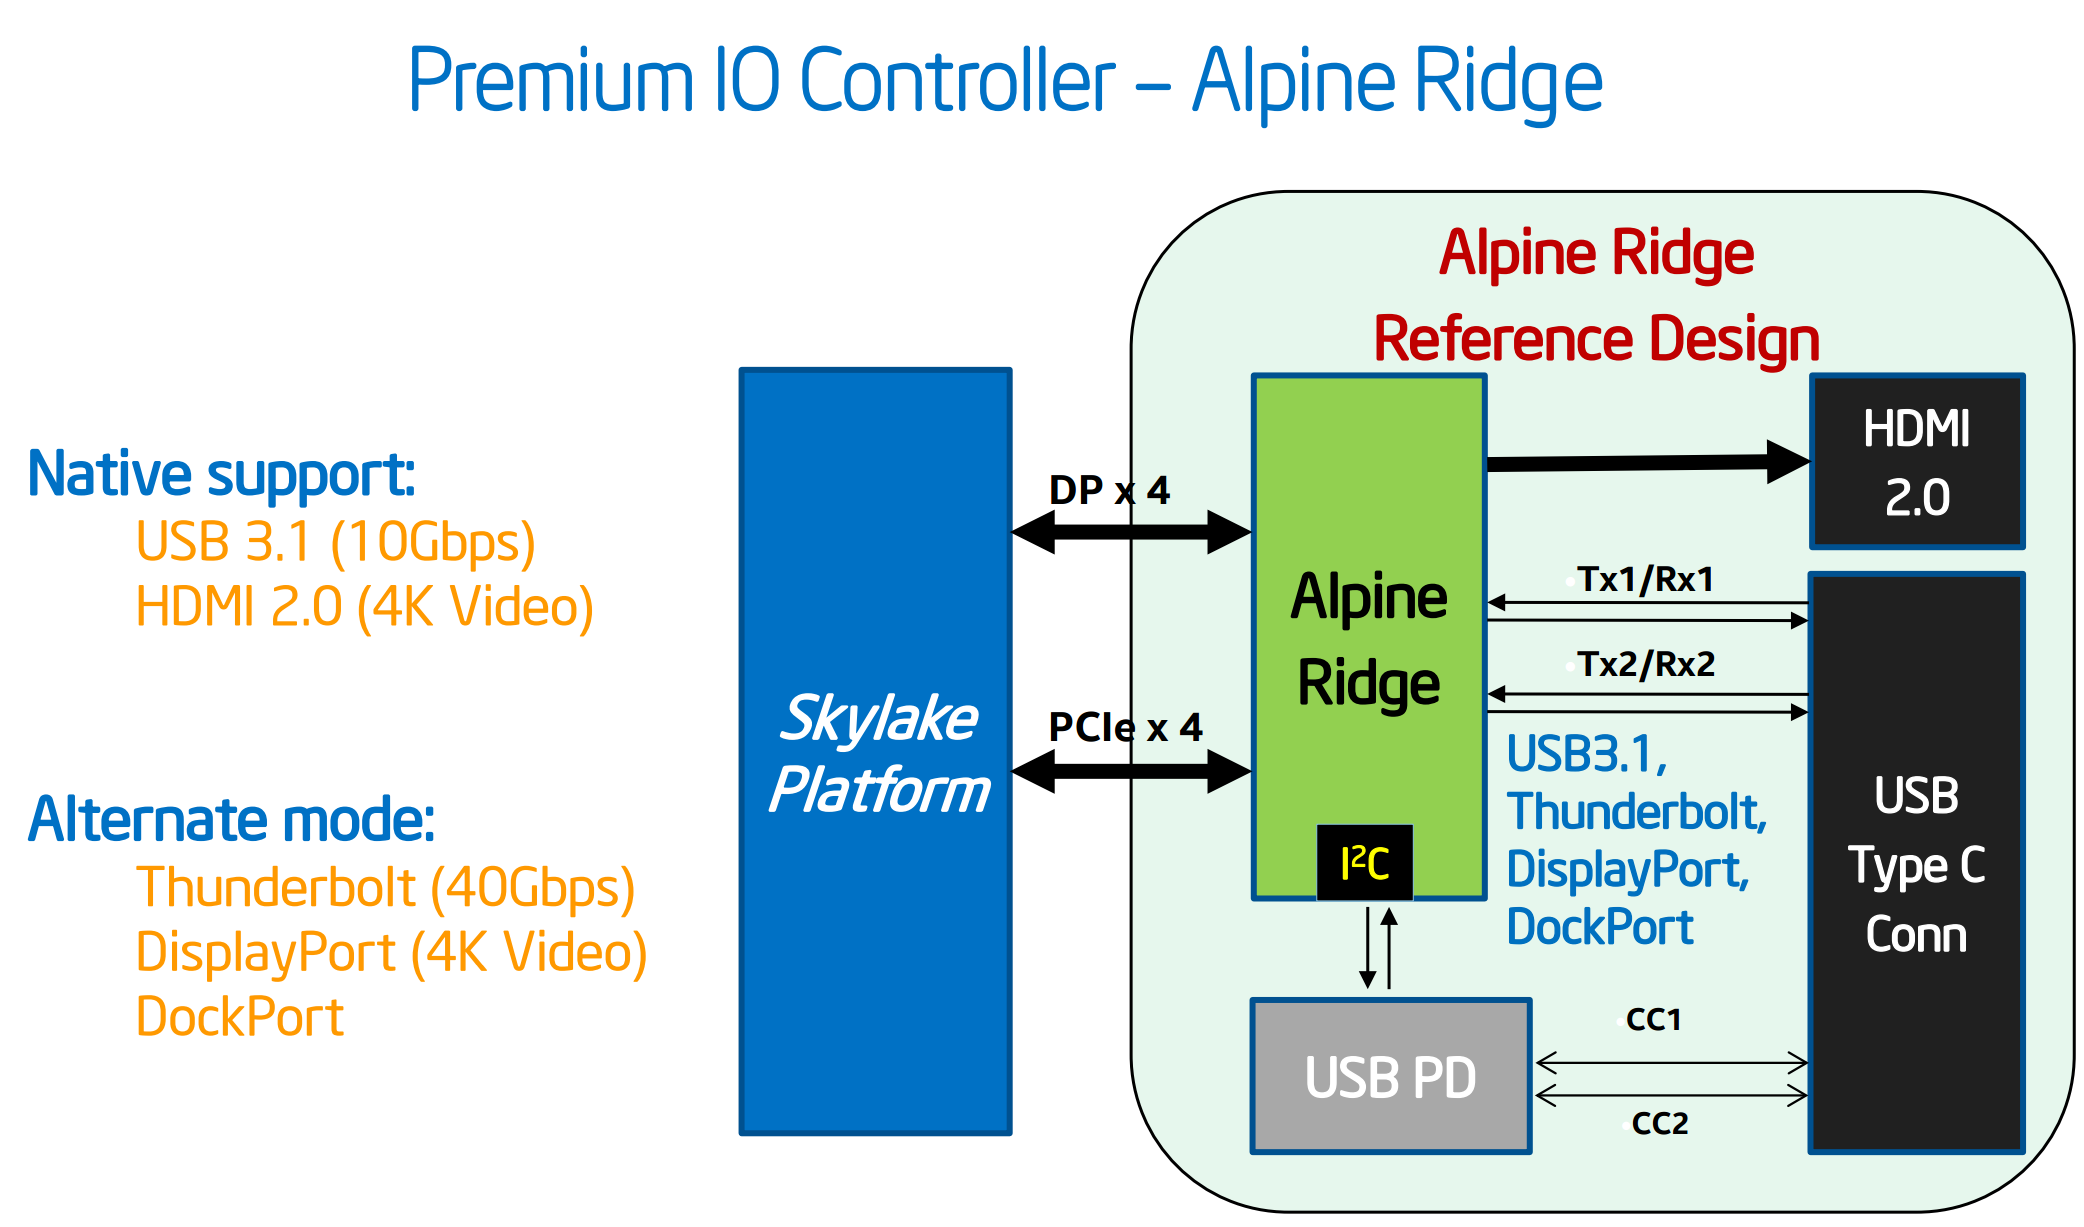
Using four PCIe lanes (and the DisplayPort lanes), the Alpine Ridge controller can support USB 3.1 Gen 2, Thunderbolt 3, and DisplayPort, and all over the USB Type-C connector as necessary. Alpine Ridge can also act as a LS-Pcon and convert the DP signal into a HDMI 2.0 signal with HDCP 2.2 support.
As mentioned in GIGABYTE’s details above, the Alpine Ridge solution will add around $10 to the cost of the board, which probably translates near $20 to the end-user cost. It is our understanding that the increased speed of the Z170 launch means that there has been supply issues with Alpine Ridge controllers and that there will be more products coming out next month (September) from various manufacturers that will use the controller.
The final companion controller we will see a lot of is Intel’s own gigabit Ethernet family, the I219 controller, named Jacksonville.

As mentioned above, the I219-V is aimed at consumers while the I219-LM is for corporate/business although I imagine we will see a mix of both on a number of motherboards, especially at the high end. The I219 series comes with better power management, so when Skylake comes to more power-conscious platforms we should see some uptake there.
I will also add that Realtek Ethernet solutions will also be seen on Z170 motherboards, typically as the cost effective solution. Back at Computex we also saw Realtek’s gaming network solution, the Dragon, with the codename 8118AS on some ECS models. Opposite that will be the Rivet Network’s Killer Ethernet controllers, specifically the E2400, as a gaming optimized model along with the marketing points that go along with it.
Audio
There are some more esoteric properties worth mentioning - the chipset now supports DMIC, digital microphone direct attach, allowing microphones to be plugged directly into the chipset without the need for an external codec. This has benefits in power saving (no need to activate an external codec) and potential cost savings (don’t buy an audio codec), specifically for features such as Wake-On-Voice.
Chipset Power and Installing Windows 7
The power into the chipset is now provided by a single power rail, rather than separate core/suspend rails, which should simplify design. Some other restrictions are also placed on PCIe routing signals, bringing the maximum length down from 10-inches to 9-inches, and also M.2 routing in PCIe 3.0 mode is also reduced. We are also informed that PCIe flex cable/daughter card arrangements are limited to PCIe 2.0 mode.
One big shock will be for Windows 7 users. By default, the Z170 chipset and BIOS will not support full USB 2.0 Enhanced Host Controller (EHCI) mode. This means that for a number of circumstances, USB devices will not work unless an XHCI environment in play.
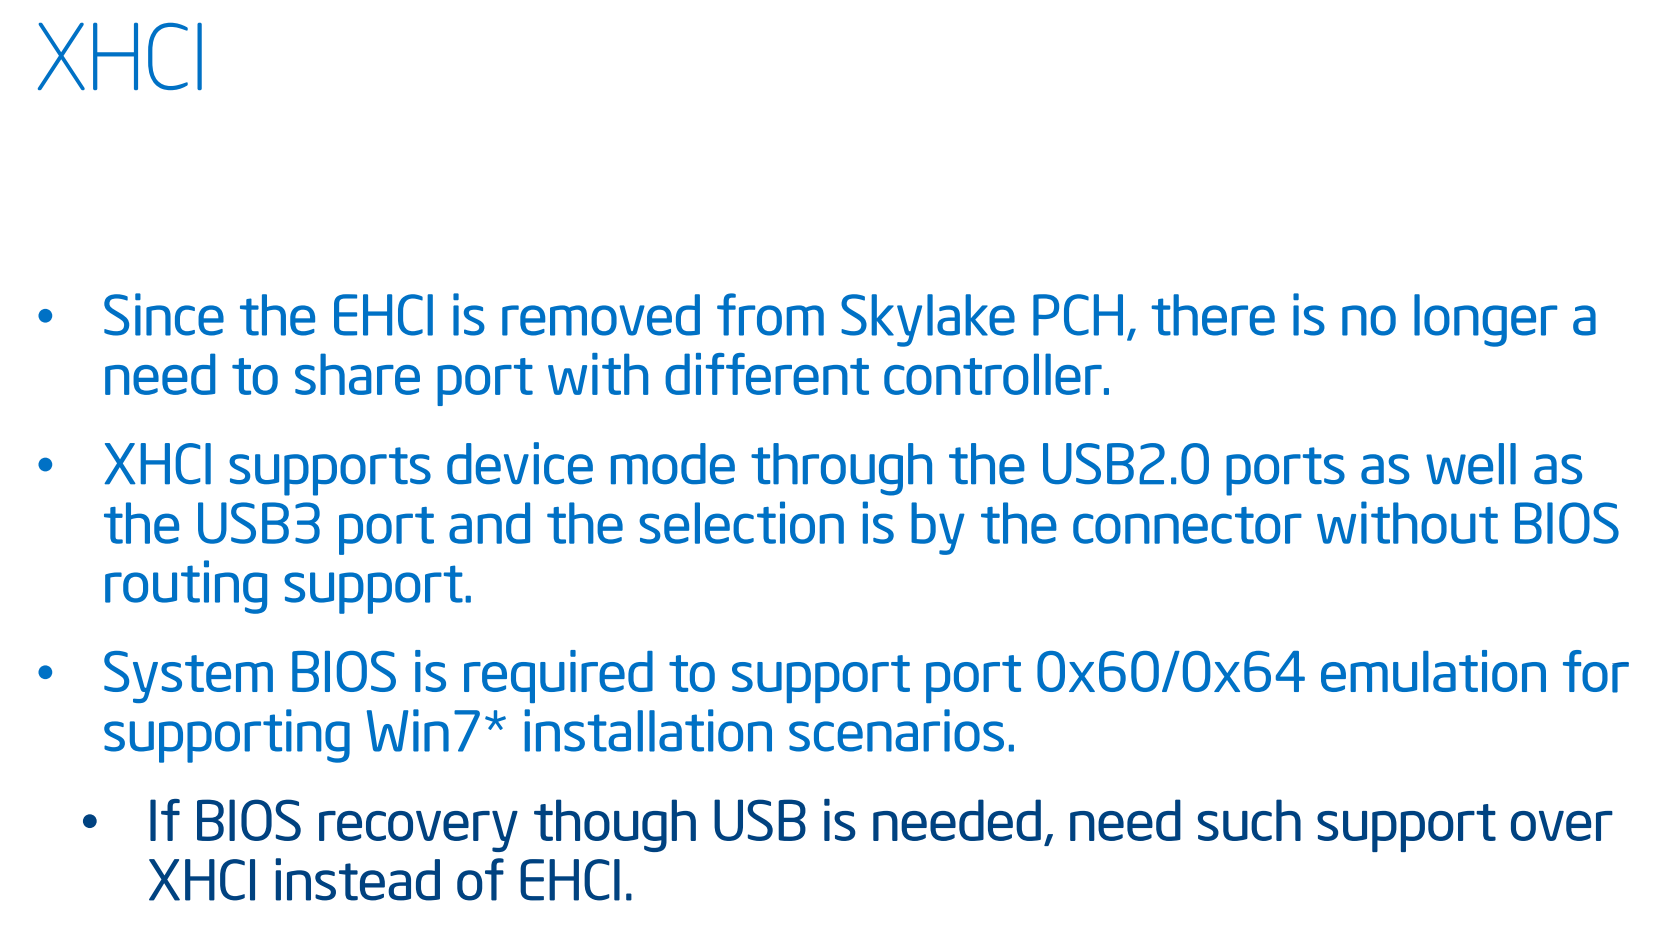
In our testing, this means that in order to install Windows 7 you need to do the following:
- Navigate to BIOS
- Enable ‘Windows 7 Installation’ or ‘EHCI mode’, Save and Exit.
- Have your Windows 7 image on an optical disk. USB sticks will not work!
- Install the OS as normal via the optical media. Install OS drivers/USB 3.0 drivers.
- Disable the BIOS option.
This is done for a couple of reasons. Firstly, it helps reduce the size of the BIOS for more customization. It also aids moving users to AHCI capable operating system installations. For everyone else, it is a bit of a headache. As far as we can tell, almost all motherboard manufacturers (at least the Tier-1s) will have this option in the BIOS to enable Windows 7 installation.
What To Expect
Z170 and the Skylake platform make a large number of fundamental changes when it comes to functionality, design and cost. By opening up the chipset HSIO/Flex-IO ports to twenty PCIe 3.0 lanes, even with specific limitations on a number of them, we should avoid the situation we had in Z97 where users might have three features but only two of them would work at once. Now we have enough lanes to enable them all.
From a personal perspective, this allows for several esoteric designs. Because the chipset is limited as a maximum to PCIe 3.0 x4 per port, imagine the system having several quad-lane SATA controllers, each giving out eight SATA 6 Gbps ports. Combining those with port multipliers might allow each controller to double its ports. That means five controllers, each with eight SATA 6 Gbps ports, then doubled with port multipliers. A motherboard with 80 SATA ports, anyone?
Perhaps I jest, but the limitation of what can be done now revolves around the imagination of the motherboard manufacturers and how much of a market is out there. They are all listening to what the customers want, and the more you want to buy the more of a say you can have. Leave interesting suggestions and combinations below.
For users waiting on other chipsets than Z170, such as H170, Q150, B150 and H110 will have to wait until later in the year when Intel releases them. For today's Skylake-K launch, only Z170 is being launched alongside it.
A Small Bit of Confusing USB Terminology
Finally, to throw a bit of a curveball in here, you will see motherboard manufacturers refer to USB 3.1 in different ways. Specifically, some manufacturers will refer to the new USB 3.1 ports as ‘USB 3.1 Gen 2’, giving 10 Gbps bandwidth, and the older USB 3.0 ports as ‘USB 3.1 Gen 1’ for 5 Gbps bandwidth. This just makes everything confusing for the buyer, and we aren't fond of these shenanigans.
| USB Standards | ||
| Standard | Max Speed | Alt. Name |
| USB 2.0 | 480Mbps | High Speed |
| USB 3.0 | 5Gbps | SuperSpeed |
| USB 3.1 Gen 1 | 5Gbps | SuperSpeed |
| USB 3.1 Gen 2 | 10Gbps | SuperSpeed+ |
For the sake of simplicity, going forward we will be doing the following:
USB 3.1 Gen 1 running at 5 Gbps will be referred to as USB 3.0
USB 3.1 Gen 2 running at 10 Gbps will be referred to as to USB 3.1
Although both Apple and MSI are using the Gen1/Gen2 terminology, we will keep it simple.
Overclocking
We covered the concept of overclocking recently in our Broadwell processor review, with the reasons why and how we test. Fundamentally, Skylake overclocking remains similar to Broadwell and other platforms as far back as Sandy Bridge wherein the final frequency (4000 MHz) is calculated by the product of the base frequency (BCLK, ~100 MHz) and the multiplier (40x). The main method of adjusting the total frequency by raising the multiplier still stands, but Skylake does offer a few more options up for users to play with.
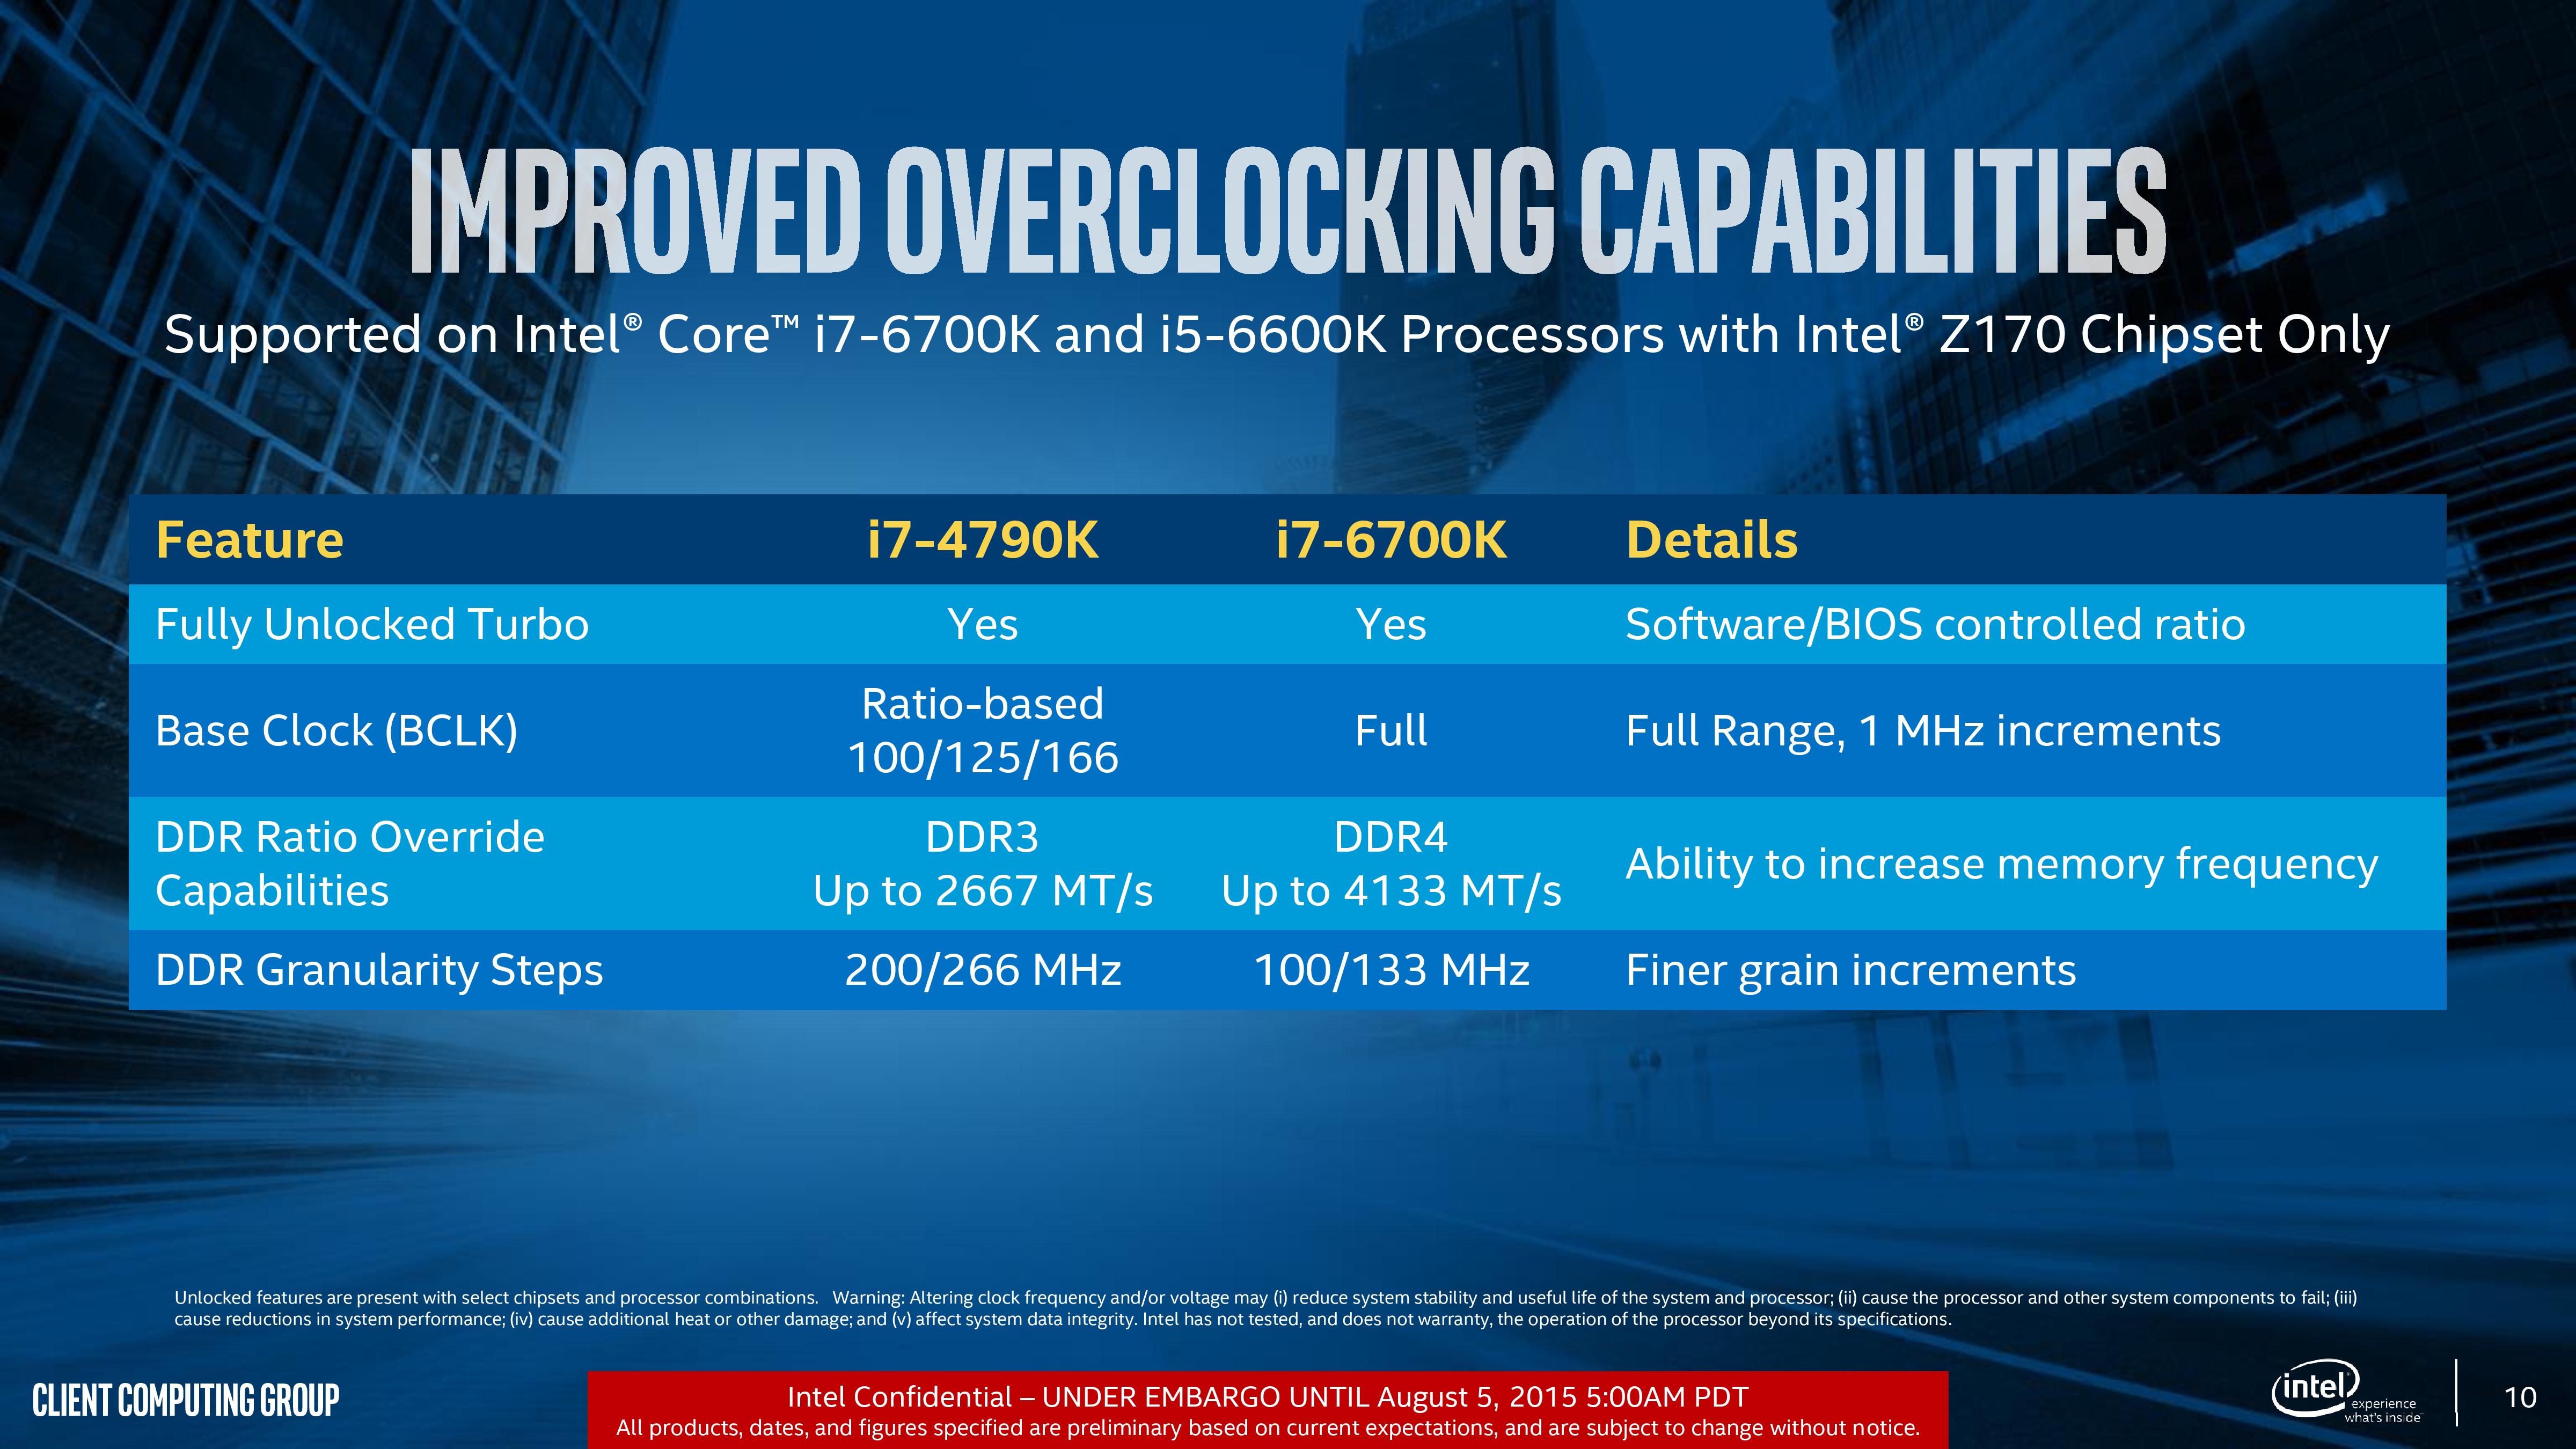
On the high level, the biggest change is that Haswell's decoupling ratios between the processor and the PCIe/DMI are gone, and the PCIe/DMI domains now run through a separate external clock. What this means is that, potentially, the way of overclocking back in 2006 with a high base frequency and low multiplier might be back, giving extreme overclockers more of a challenge.
Previously, when the base frequency was adjusted (100 MHz to 120 MHz), this would push the PCIe frequency too far out of alignment resulting in a lack stability, so the decoupling ratios were there to realign the PCIe clock back to normal (so a ratio of 1.25 means a setting of 120 MHz on the CPU gave 120/125 = 96 MHz on the PCIe, which is more stable). What Skylake does is separate the clock domains altogether, so we get a full range of BCLK adjustments for the processor from 100 MHz to 200-300 MHz in 1 MHz increments. Some motherboard manufacturers have extra components on board to either boost that range to 650 MHz+, or add a finer BCLK adjustment system to allow for 0.0625 MHz steps instead.
For DRAM, the DDR4 base specification is at DDR4-2133 for regular JEDEC timings. Skylake is still technically qualified at this speed, but Intel expects to see reports of memory nearer DDR4-4133 in due course. This is helped by allowing 100/133 MHz dividers for memory frequency, rather than the previous 200/266, for a finer division in memory selection to increase high frequency/multi-module stability.

As the transition from Haswell/Broadwell to Skylake removes the integrated voltage controller and puts said voltage control back on to the motherboard, the processor now accepts three main voltage inputs for the cores, the memory subsystem/controller and the integrated graphics. These can be monitored externally as well to ensure accuracy beyond that of software. The image above is an early diagram of Skylake, but we believe the maximum ratios listed will be present on Z170. Despite the maximum memory ratio listed as 32 @ 100 MHz, for the faster DRAM kits the difference is expected to be made up with base frequency adjustments (e.g. DDR4-3600 is 18 x 200 or some other combination).
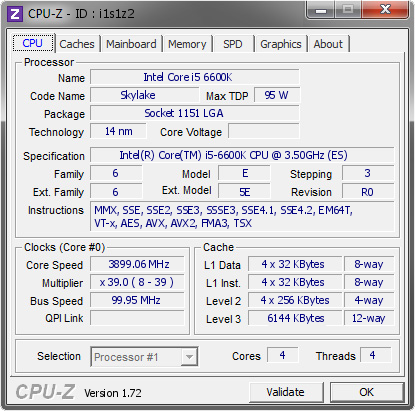
What to Expect – Will it beat my i7-2600K at 4.7 GHz?
Over the course of our testing, we managed to secure separate processor samples at different times before the launch date. As a result we had a mixed amount of engineering samples as well as our retail review sample from Intel, as well as new motherboards that were still having their BIOSes fine-tuned to get the most performance. As with most launch day overclocking, there is probably an element of maturity needed in the firmware to get the best out of it. But nonetheless, some users will be going and buying hardware today, and this is what we achieved.
I want to bring back a table from our past Broadwell review:
| Intel 24/7 Overclocking Expected Results in MHz | |||
| Stock Speed | Good OC | Great OC | |
| Sandy Bridge i7 | 3400 | 4700 | 4900 |
| Ivy Bridge i7 | 3500 | 4500 | 4700 |
| Haswell i7 | 3500 | 4300 | 4500 |
| Broadwell i7 | 3300 | 4100 | 4300 |
Some users disagreed with the numbers I put in here, because ultimately the quality of the silicon and the luck of the draw can dictate how good (or great) an overclocking processor is. Personally a lot of the people I talk to in this industry are both technical and overclockers, or who people arrange processors for system integrators – when you go through a few hundred samples, you can get a feeling of how good/bad a processor family is without single-use anecdotal evidence. There will always be outliers, both good and bad (I’ve had my fair share of bad). But an interesting element to all of this is the variability of getting a good overclock.
Why do I mention this? Well I want to cycle back into the question in the title of this section: ‘will it beat my i7-2600K at 4.7 GHz?’. Users who have wanted to upgrade for several generations have recently been disappointed because despite the increase in per-MHz performance, the ‘average’ overclock frequency goes down by a similar amount. A lot of these users feel there is no point upgrading if you keep side-stepping (even if the chipset functionality gets better). So for Skylake to be a successful upgrade path, it has to be in line with people’s expectations of overclocking, and ideally achieve a frequency that is reliable across many samples.
Skylake does have one thorn in its side however – and that is Devil’s Canyon. DC was the name given to the upgraded Haswell-based i7-4790K and i5-4690K, both of which used an upgraded package to reduce temperatures and improve overclocking. Some users went from i7-2600K to i7-4790K because the high base frequency and mildly increase overclocking were interesting jumps. To users already on i7-4790K, this article probably isn’t a buying suggestion to you anyway. But Skylake has to perform well versus the i7-4790K too – there is no real point in just matching its performance.
So, without further delay, here is what we achieved. At each multiplier we adjusted the frequency up in steps of +0.025 volts until it was stable and the temperature was still within limits.
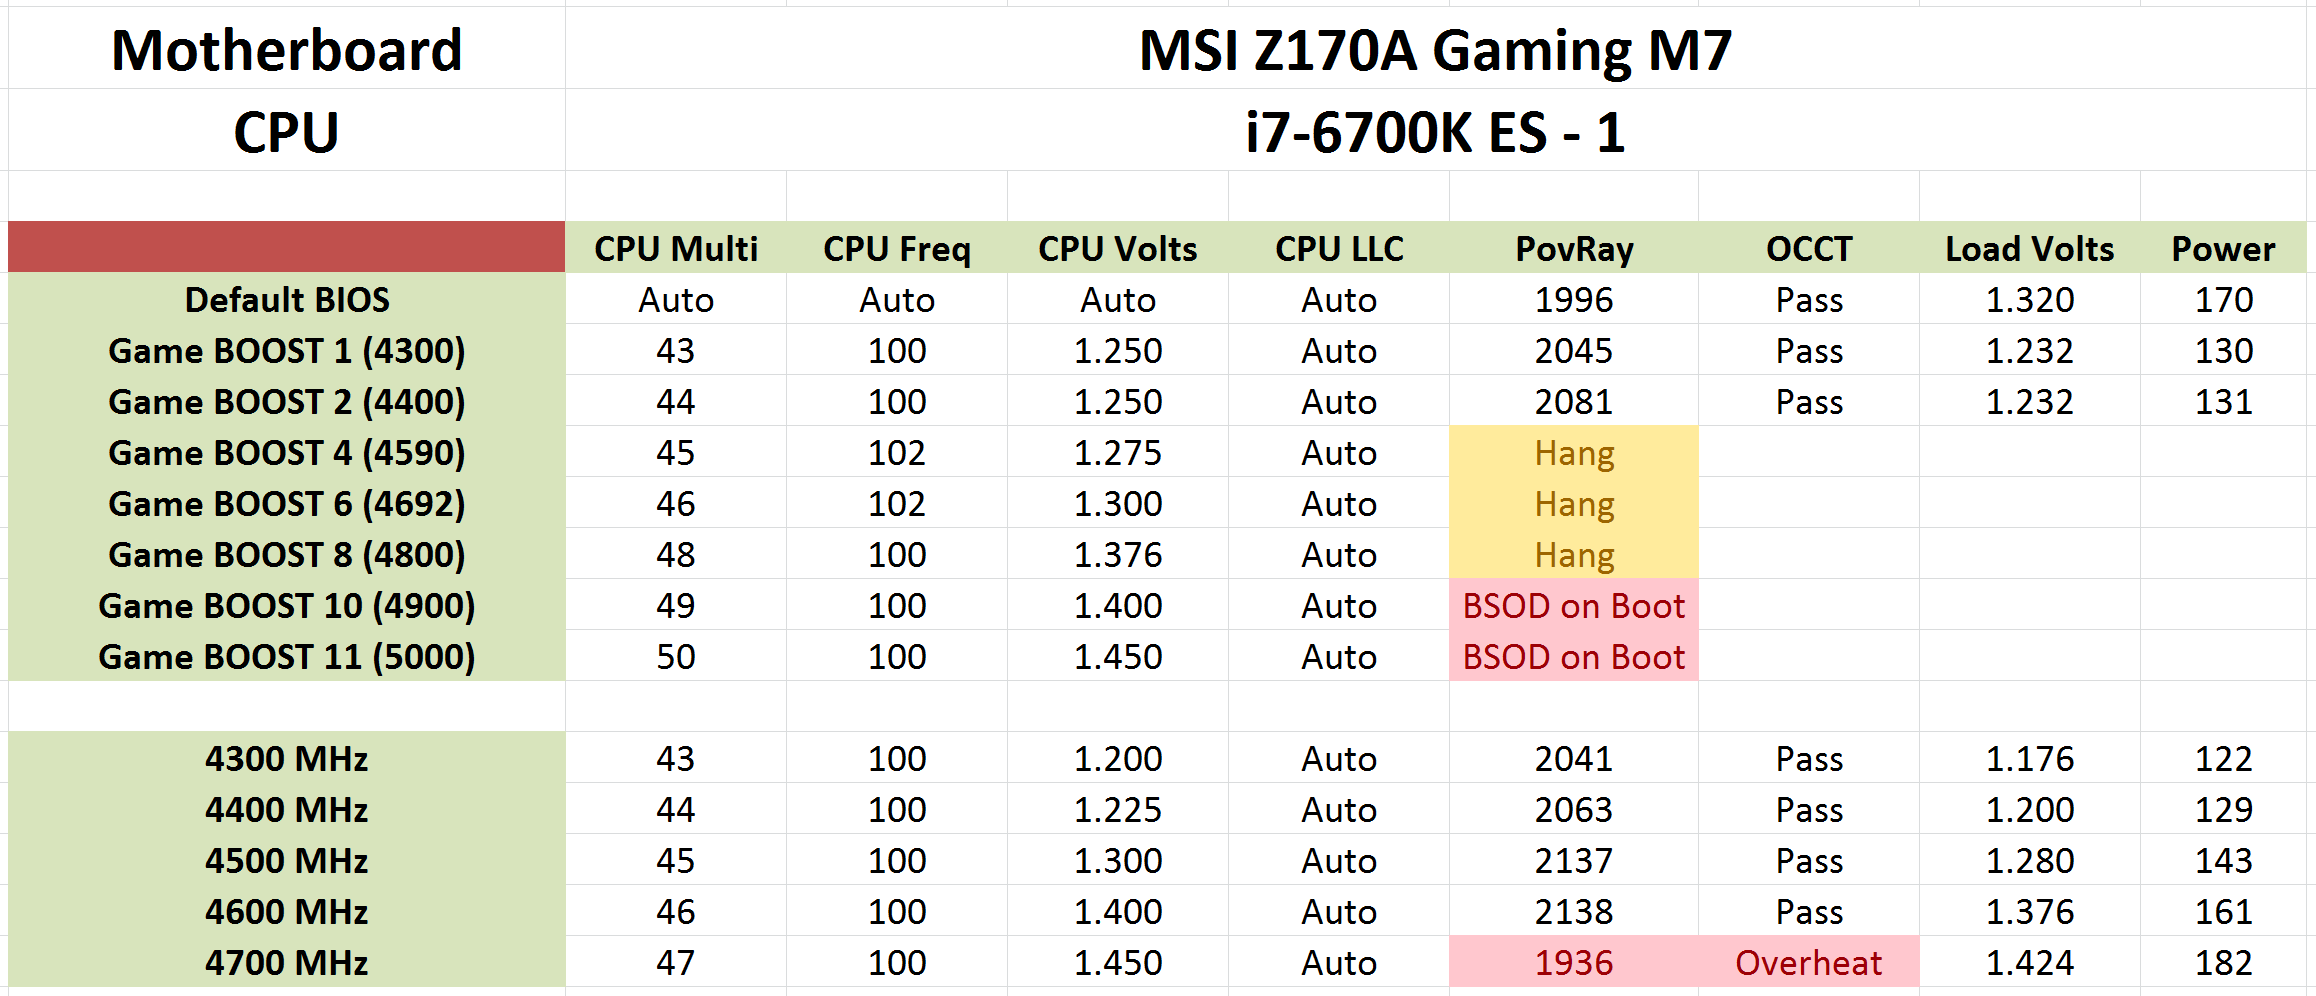
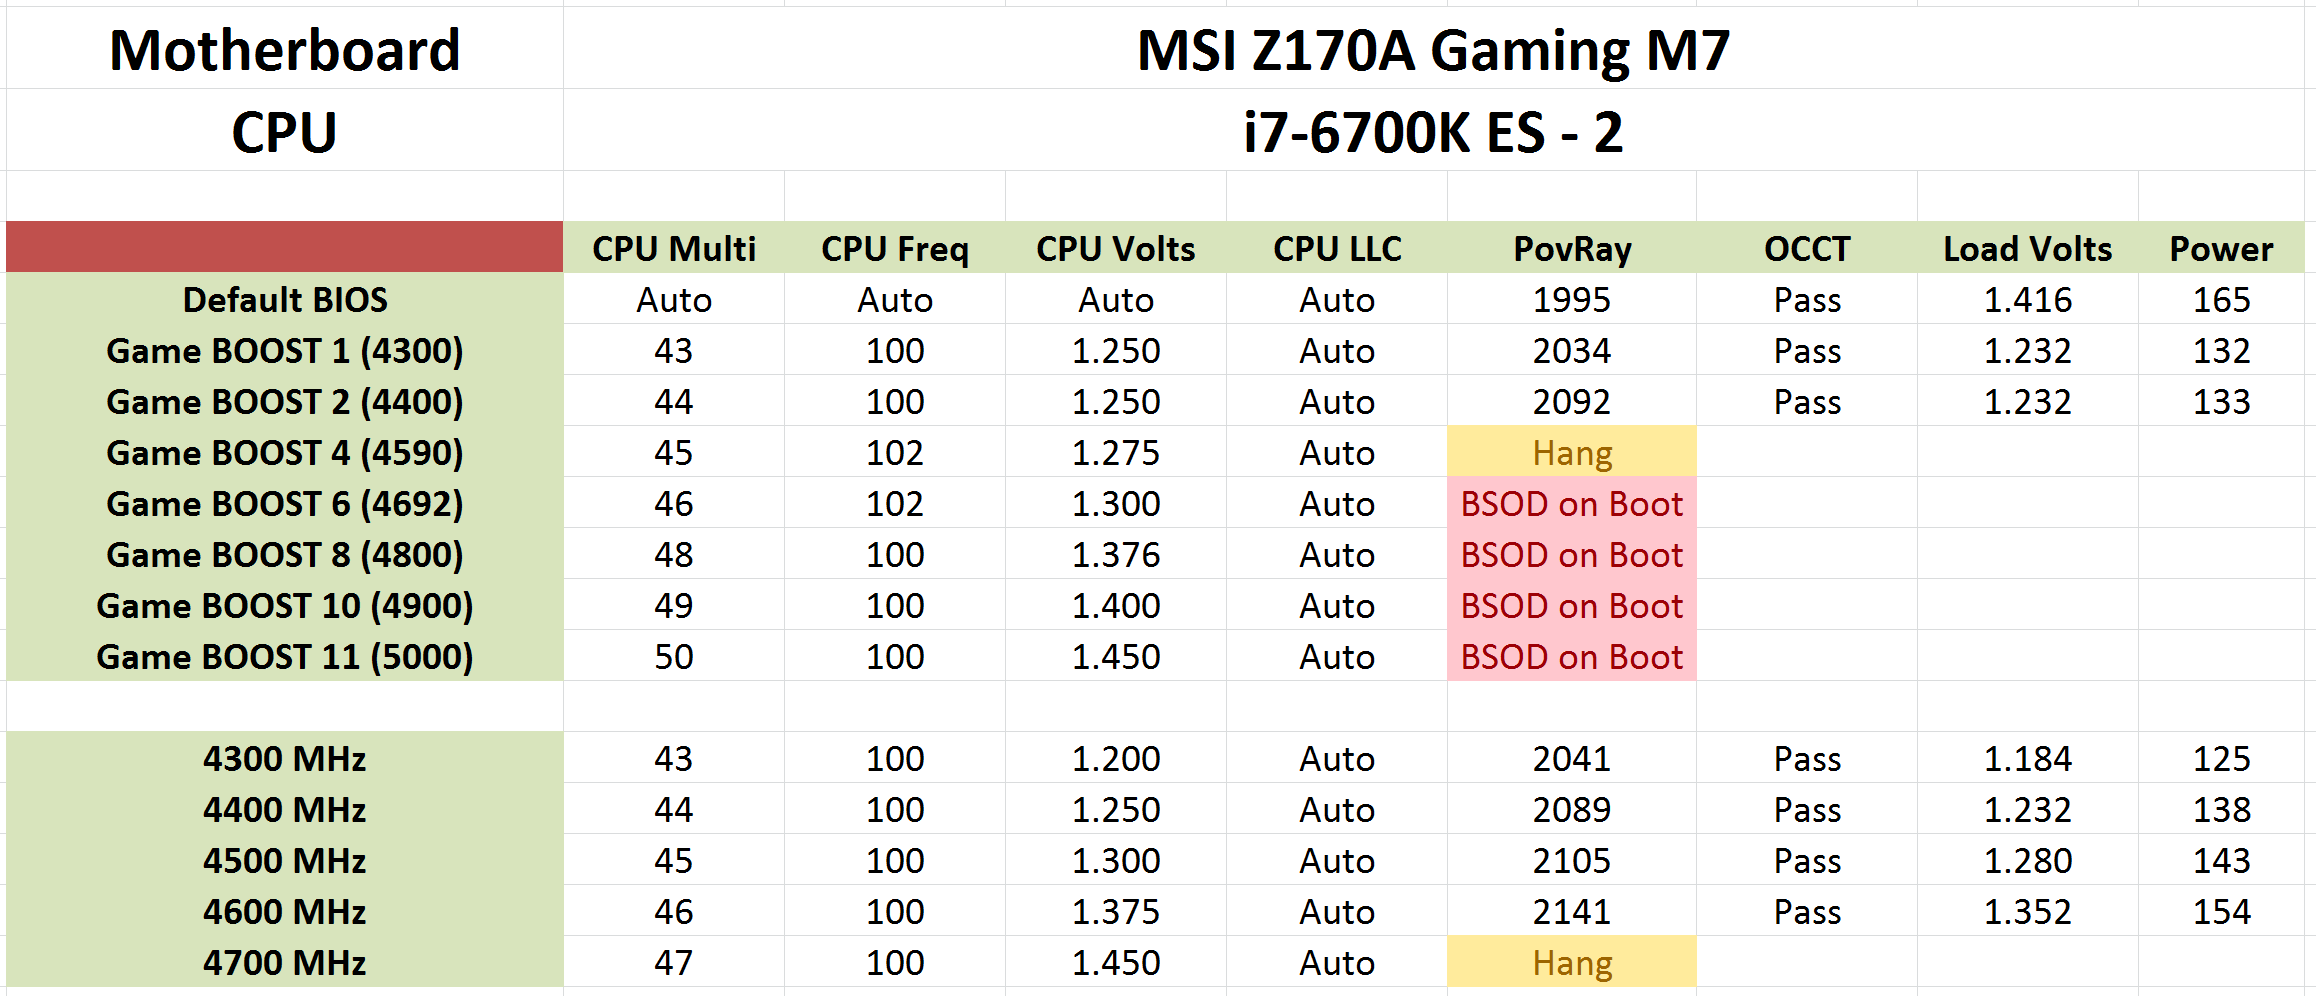
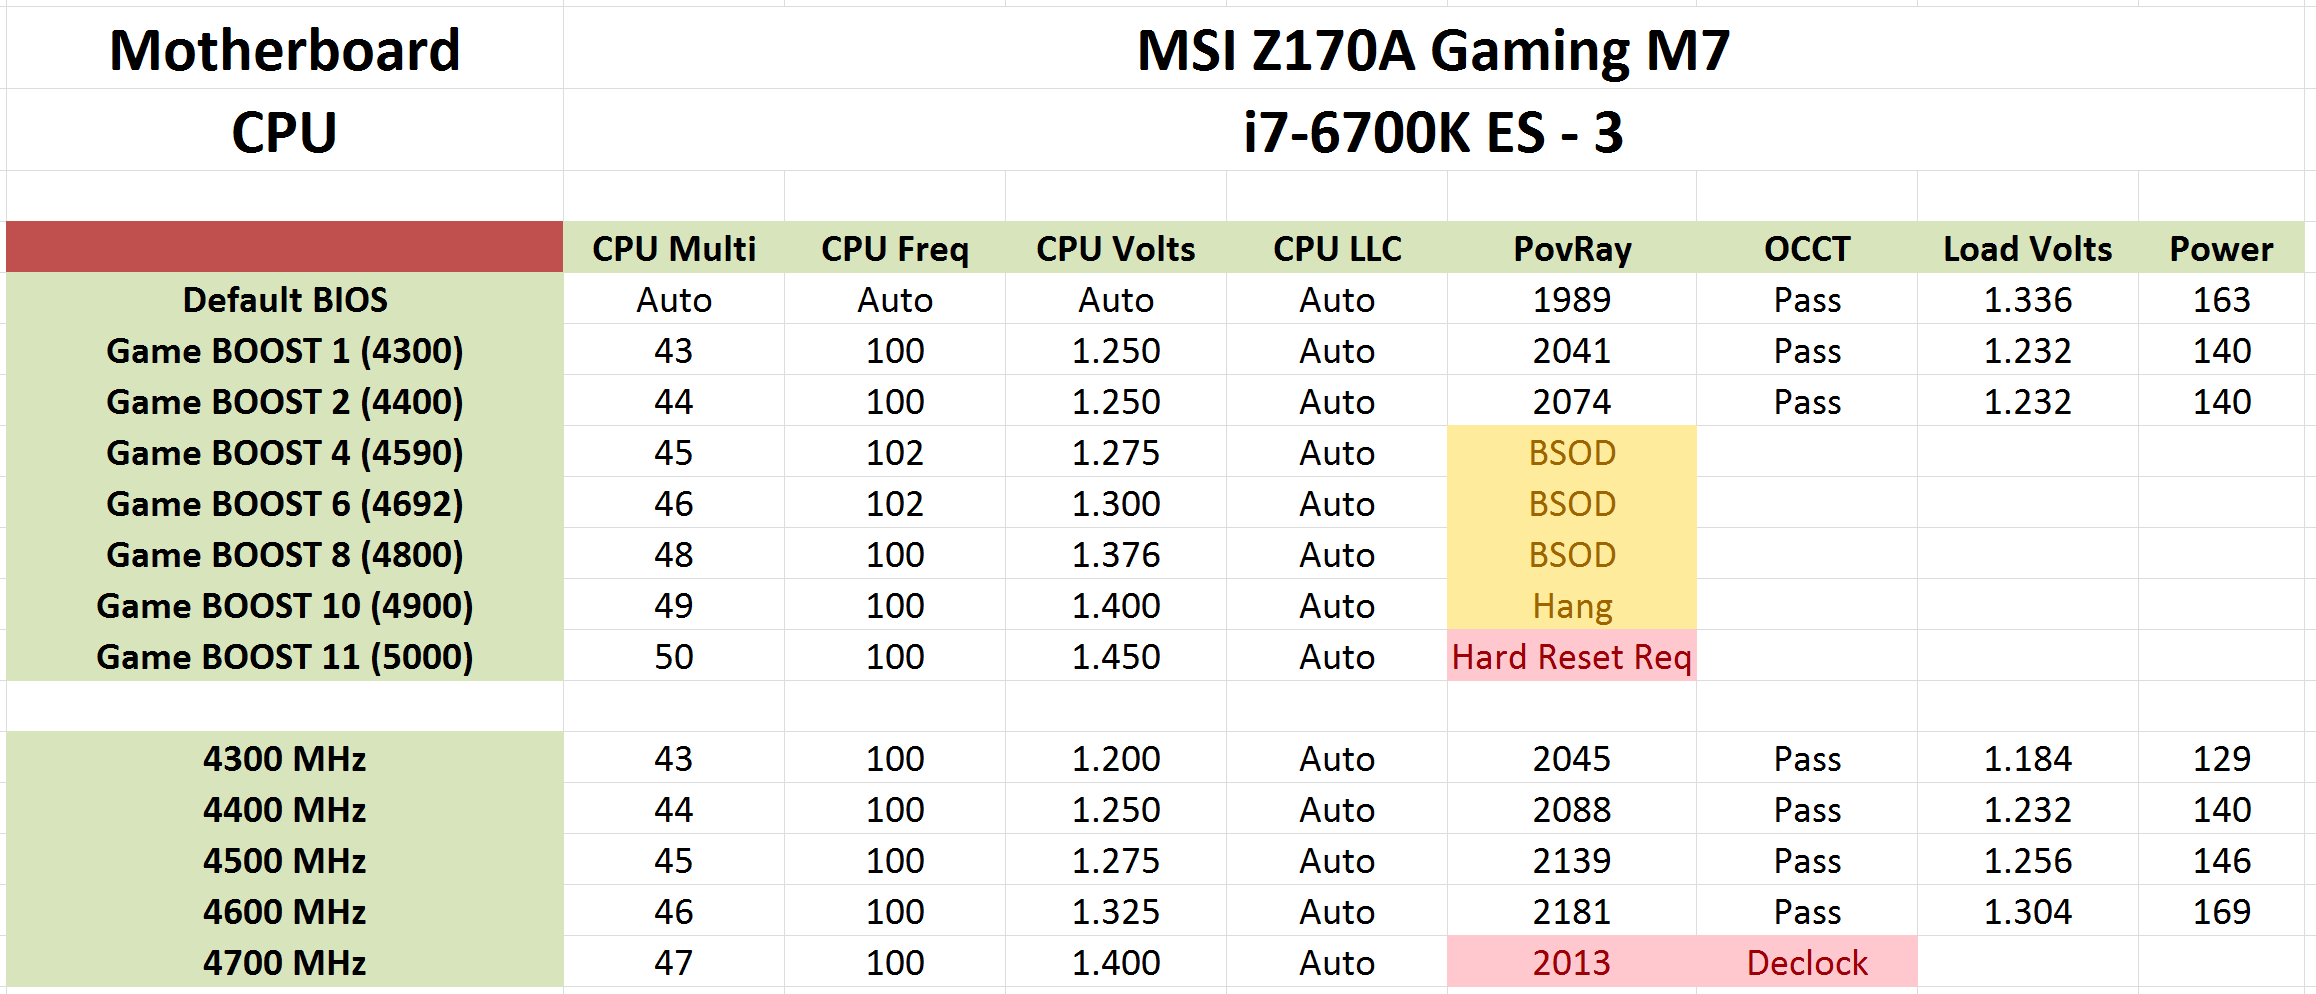
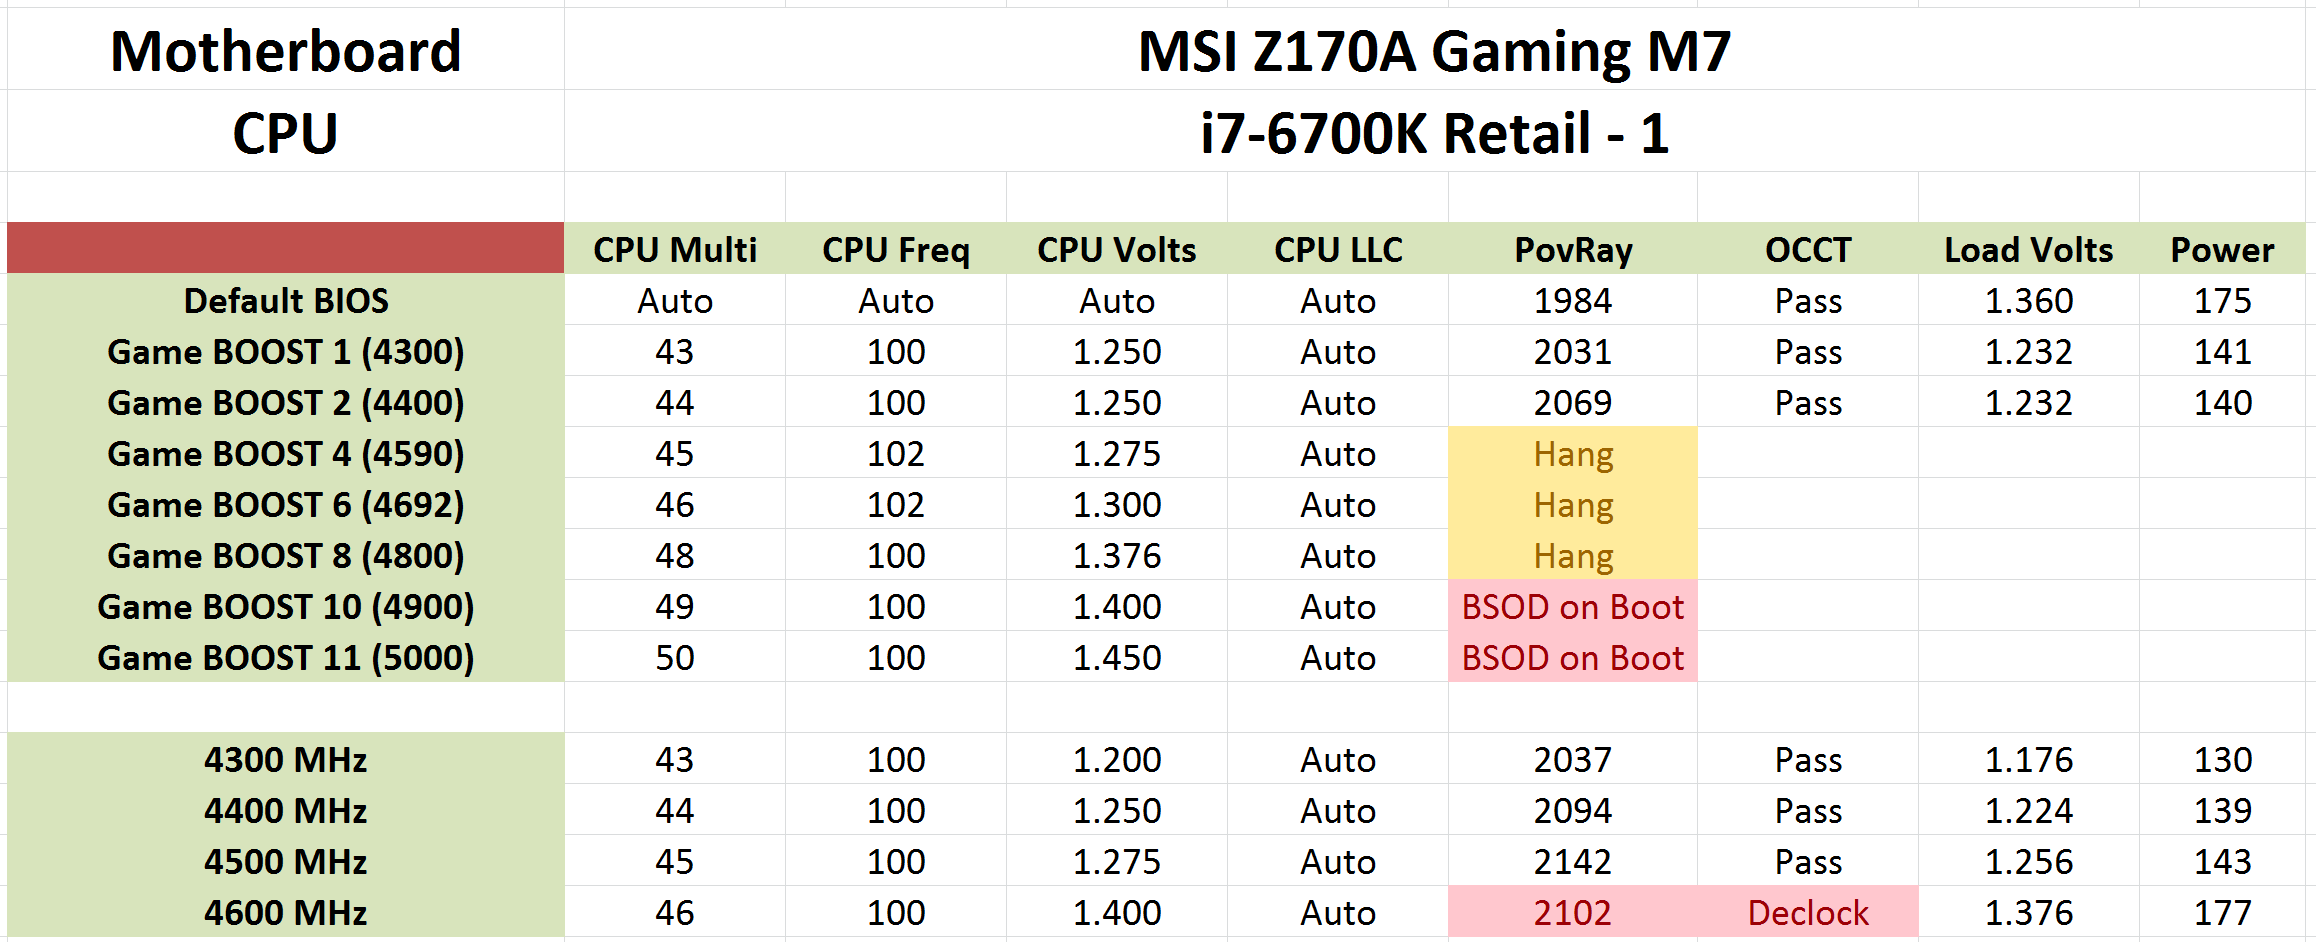
Out of the four samples, one engineering sample had 4.7 GHz at 1.4V two engineering samples achieved 4.6 GHz at ~1.4V and the one retail sample had 4.5 GHz at 1.275 volts before declocking when it was running at 4.6 GHz / 1.4 volts.
To add to the mix, I have had two different manufacturers (MSI and ASUS) both confirm that internally they are seeing the majority of their samples hit around the 4.6 GHz mark, and it seems to be very consistent. A couple of my fellow reviewers have also been in contact with what they have, with more reports around the 4.6-4.7 GHz mark, some at 4.8 GHz and one even at 5.0 GHz at 1.45 volts, although I wasn’t told of the stability at that point.
So it seems that an average overclock, albeit with a good cooler in nice conditions, is around the 4.6 GHz mark with a great overclock more towards to 4.8 GHz. Note that this is still early in the product lifecycle and BIOSes can still improve. But I should mention two clear points we observed during testing:
Number one: thermal paste matters. If you want to extrapolate the mockup package press shots Intel supplied, the die for Skylake is longer in one dimension than the other. This would suggest that thermal paste application is best suited to a line from top to bottom (with the triangle in the bottom left) rather than a pea. From my own anecdotal testing, this is certainly the case – dropping 10-15ºC during load temperatures straight away.
Number two: Skylake is more thermally limited than voltage limited. In all the samples I had, as well as a number of results from other reviewers, the main barrier to overclocking was that at some point the thermal limits of the processor kicked in and it reduced both frequency and voltage to recover. With sufficient cooling, such as a water chiller, this means that Skylake could be a really nice overclocker. It also brings up the question of whether Intel is limiting the overclocking potential with sub-standard paste between the die and the heatspreader. We’ve been told (not by Intel) that removing the heatspreader is relatively easy, but from reports it seems that the heatspreader seems to be thinner than before and the paste is only slightly better than what Haswell came with.
For users monitoring temperatures, they will see a nice low idle near ambient, but any serious workload will cause it to shoot up very quickly. Skylake is fighting the fact that it is made on the 14nm process, meaning that important logic circuits are next to each other and heat generation for the whole processor is localized over a smaller area with more transistors per square millimeter. On the plus side, whether it is the lack of the FIVR on the processor or something fundamental in the silicon, it certainly feels like there is some headroom to push in the right circumstances.
Another point to mention is stock voltage. On the samples we tested at least, the stock voltage of the processor under load seemed astronomical, varying from 1.320 volts to 1.416 volts. Having a ~0.100 volt variation between silicon is not fun for stock use, even with the retail sample being at 1.360 volts. That being said, all the processors happily combined an overclock to 4.3 GHz with a nice underclock to 1.200 volts, which might be the best thing to do when owning the chip.
All of the processors we tested scored 4.5 GHz at around 1.300 volts. Does this weigh up against a 4.7 GHz i7-2600K as a replacement? Here are the numbers for you:
- A 4% frequency gap,
- A 25% average CPU instructions per clock improvement (see next few pages)
- Z170 chipset and PCIe storage
- DDR4
If that was the data I had I’d probably suggest an upgrade, especially as you can re-use the high-end cooling in the new system.
Overclocking - Thoughts
This decade is an interesting one for overclocking. For the first time overclocking was mentioned in an Intel keynote presentation last year when Lisa Graff announced Devil’s Canyon, and with this Skylake launch we are further told that Intel is committed to overclocking. As a result we get a wider range of overclocking options as outlined above.
That being said, there are some concerns (in a general sense). The concept of warranty technically goes out of the window with an overclock, which dissuades a lot of users from overclocking in the first place. Also, the one overclocking part that might invigorate this part of the market, an overclockable i3 processor, is still ever elusive. Rather than allowing everything to overclock like the Good Old Days™, it is restricted to either high end components that cost a lot anyway, or Pentium parts that lack the cores and features (e.g. AVX) to push performance no matter what the overclock is. The easy argument to make here is that Intel holds all the cards – there’s no competition at the high end, so why would they hurt margins and profits? But the answer comes back around to the fact that Intel states that they are committed to overclocking. I’d love to see an i3 part in the future, but I suspect we will have to wait and see if Intel gets serious competition again.
If you look at the direct popularity of overclocking in the last ten years using the vague metric of Google Trends for both ‘overclocking’ as a search term and as a hobby, we see that as a search interest it is down to 7-12% of its peak interest. What used to be a task for the 15-30 group to get more performance out of their low end system has disappeared because (a) low end systems do not overclock and (b) popular lower-intensity eSports games like League of Legends and DOTA2 mean that you do not need to. That leaves the 25+ group, who grew up on overclocking and want to push the mid-high end system further, as Intel’s market. Sure there are a few of the younger generations who do overclock, or buy systems with overclocking processors in them, but it seems they are not as enthralled as we used to be. Here’s a suggestion: bring back the old turbo button on a chassis. When we saw 66 MHz become 75 MHz, it was the start of something magical. If Intel wants to grow overclocking, that’s a fun place to start.
Disclaimer: Due to time constraints, we still have to run our benchmark suite on both processors while overclocked. This is planned for the future, although due to IDF and other events, September might be the best timeframe to aim for. We also have plans in the works to investigate the distribution of Skylake overclocking. Stay tuned for both!
Test Setup
| Test Setup | |||||||||||||||||||||||||||||||
| Processor |
|
||||||||||||||||||||||||||||||
| Motherboards | MSI Z170A Gaming M7 ASUS Z170-A |
||||||||||||||||||||||||||||||
| Cooling | Cooler Master Nepton 140XL | ||||||||||||||||||||||||||||||
| Power Supply | OCZ 1250W Gold ZX Series | ||||||||||||||||||||||||||||||
| Memory | Corsair DDR4-2133 2x8 G.Skill DDR4-2133 2x8 G.Skill DDR3-1866 4x4 *Memory Timings used were the supported frequencies of each architecture, except DDR3L vs DDR4 testing, which used DDR3-1866 C9. For Skylake's DDR3L requirement, this was a DDR3 kit running with an undervolt to 1.42V. At 1.5V, the system failed to boot. |
||||||||||||||||||||||||||||||
| Video Cards | ASUS GTX 980 Strix 4GB MSI GTX 770 Lightning 2GB (1150/1202 Boost) ASUS R7 240 2GB |
||||||||||||||||||||||||||||||
| Hard Drive | Crucial MX200 1TB | ||||||||||||||||||||||||||||||
| Optical Drive | LG GH22NS50 | ||||||||||||||||||||||||||||||
| Case | Open Test Bed | ||||||||||||||||||||||||||||||
| Operating System | Windows 7 64-bit SP1 | ||||||||||||||||||||||||||||||
Many thanks to...
We must thank the following companies for kindly providing hardware for our test bed:
Thank you to AMD for providing us with the R9 290X 4GB GPUs.
Thank you to ASUS for providing us with GTX 980 Strix GPUs and the R7 240 DDR3 GPU.
Thank you to ASRock and ASUS for providing us with some IO testing kit.
Thank you to Cooler Master for providing us with Nepton 140XL CLCs.
Thank you to Corsair for providing us with an AX1200i PSU.
Thank you to Crucial for providing us with MX200 SSDs.
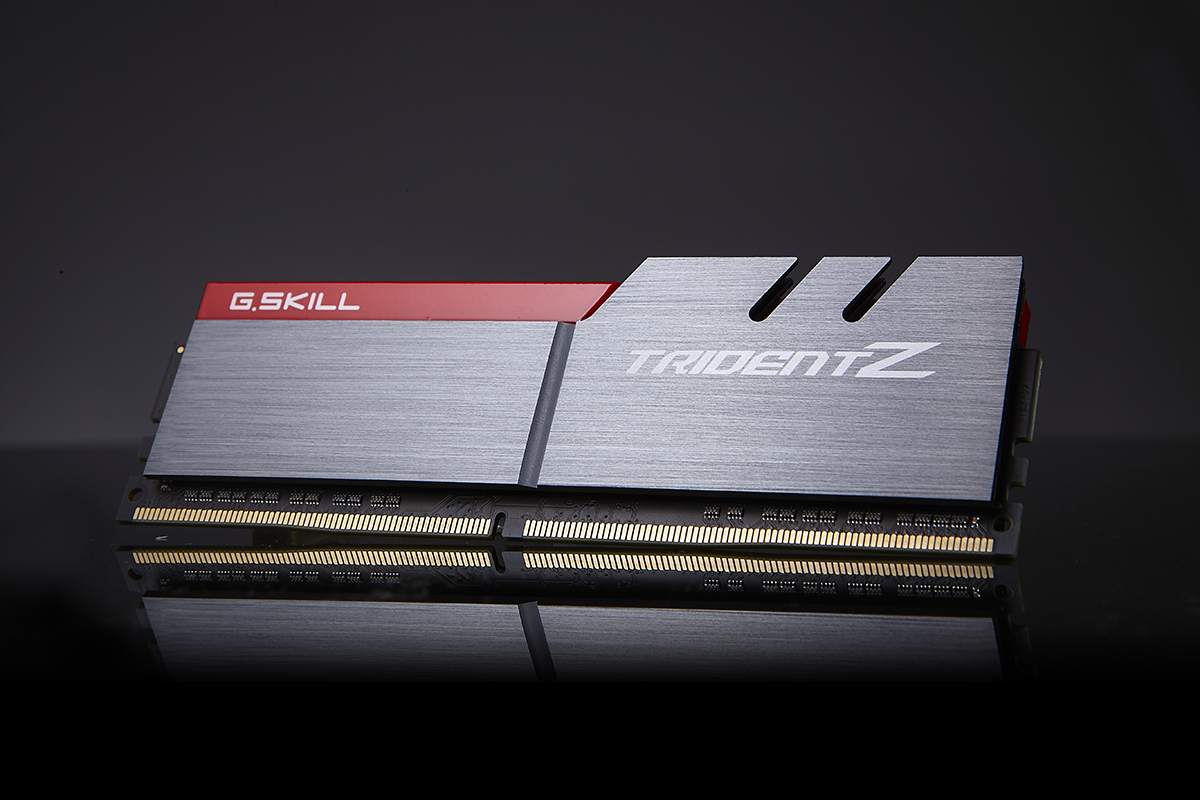
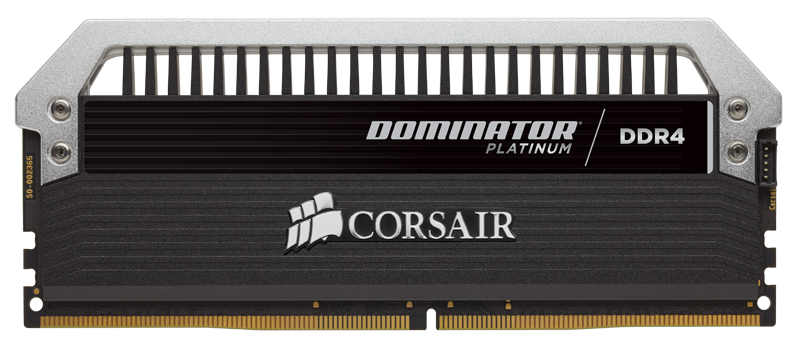
Thank you to G.Skill and Corsair for providing us with memory.
Thank you to MSI for providing us with the GTX 770 Lightning GPUs.
Thank you to OCZ for providing us with PSUs.
Thank you to Rosewill for providing us with PSUs and RK-9100 keyboards.
Load Delta Power Consumption
Power consumption was tested on the system while in a single MSI GTX 770 Lightning configuration with a wall meter connected to the OCZ 1250W power supply. This power supply is Gold rated, and as I am in the UK on a 230-240 V supply, leads to ~75% efficiency > 50W, and 90%+ efficiency at 250W, suitable for both idle and multi-GPU loading. This method of power reading allows us to compare the power management of the UEFI and the board to supply components with power under load, and includes typical PSU losses due to efficiency.
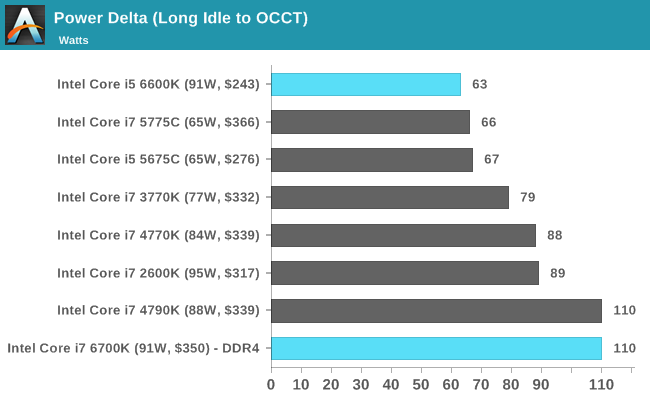
Using our delta between idle and AVX, the i7-6700K comes in at a higher-than-TDP 110W, but matches the i7-4790K which technically has a lower TDP. Though it is worth mentioning that as stated above, it seems that either the processor or motherboard sets a relatively high stock voltage under load, but a combination overclock/undervolt happily brings the power consumption back down while remaining stable. We might see motherboard BIOSes adapt to this over time.
DDR4 vs DDR3L on the CPU
One of the big questions when DDR4 was launched was around the comparison to DDR3. Was it better, was it worse? DDR4 by default switches down to an operating voltage of 1.2 volts from 1.5 volts, making it more power efficient, and the standard increases the maximum capacity on an unbuffered memory module. There are also some other enhancements such as per-IC voltage drop control and a design to aid DRAM placement in motherboards. But there was one big scary number – a CAS Latency of 15 (known as C15 or CL15).
Let’s do a quick memory recap on frequency (technically, transfer rate but used interchangeably for this purpose) against latency.
The CAS latency is the number of clocks taken between an access request from the memory controller to actually acting on that request. So a CL of 15 means that there are 15 clocks between that request and getting access. Generally, a lower CL is better.
The Frequency is the rate at which those clocks occur. DDR stands for Double Data Rate, which means that in one hertz in the frequency there are two requests – one each on the rise and fall of the clock signal. The reciprocal of the frequency/transfer rate (one divided by the frequency) is the time taken to perform a clock.
But the important thing here is that the latency is a number of clocks and thus is just a number, and the frequency determines how fast these clocks go. So on its own the CAS Latency value doesn’t say much. The important metric is when the two are used together -the true latency is the CAS Latency * Time taken per clock, and here’s a table of values from Crucial’s recent whitepaper on the subject:
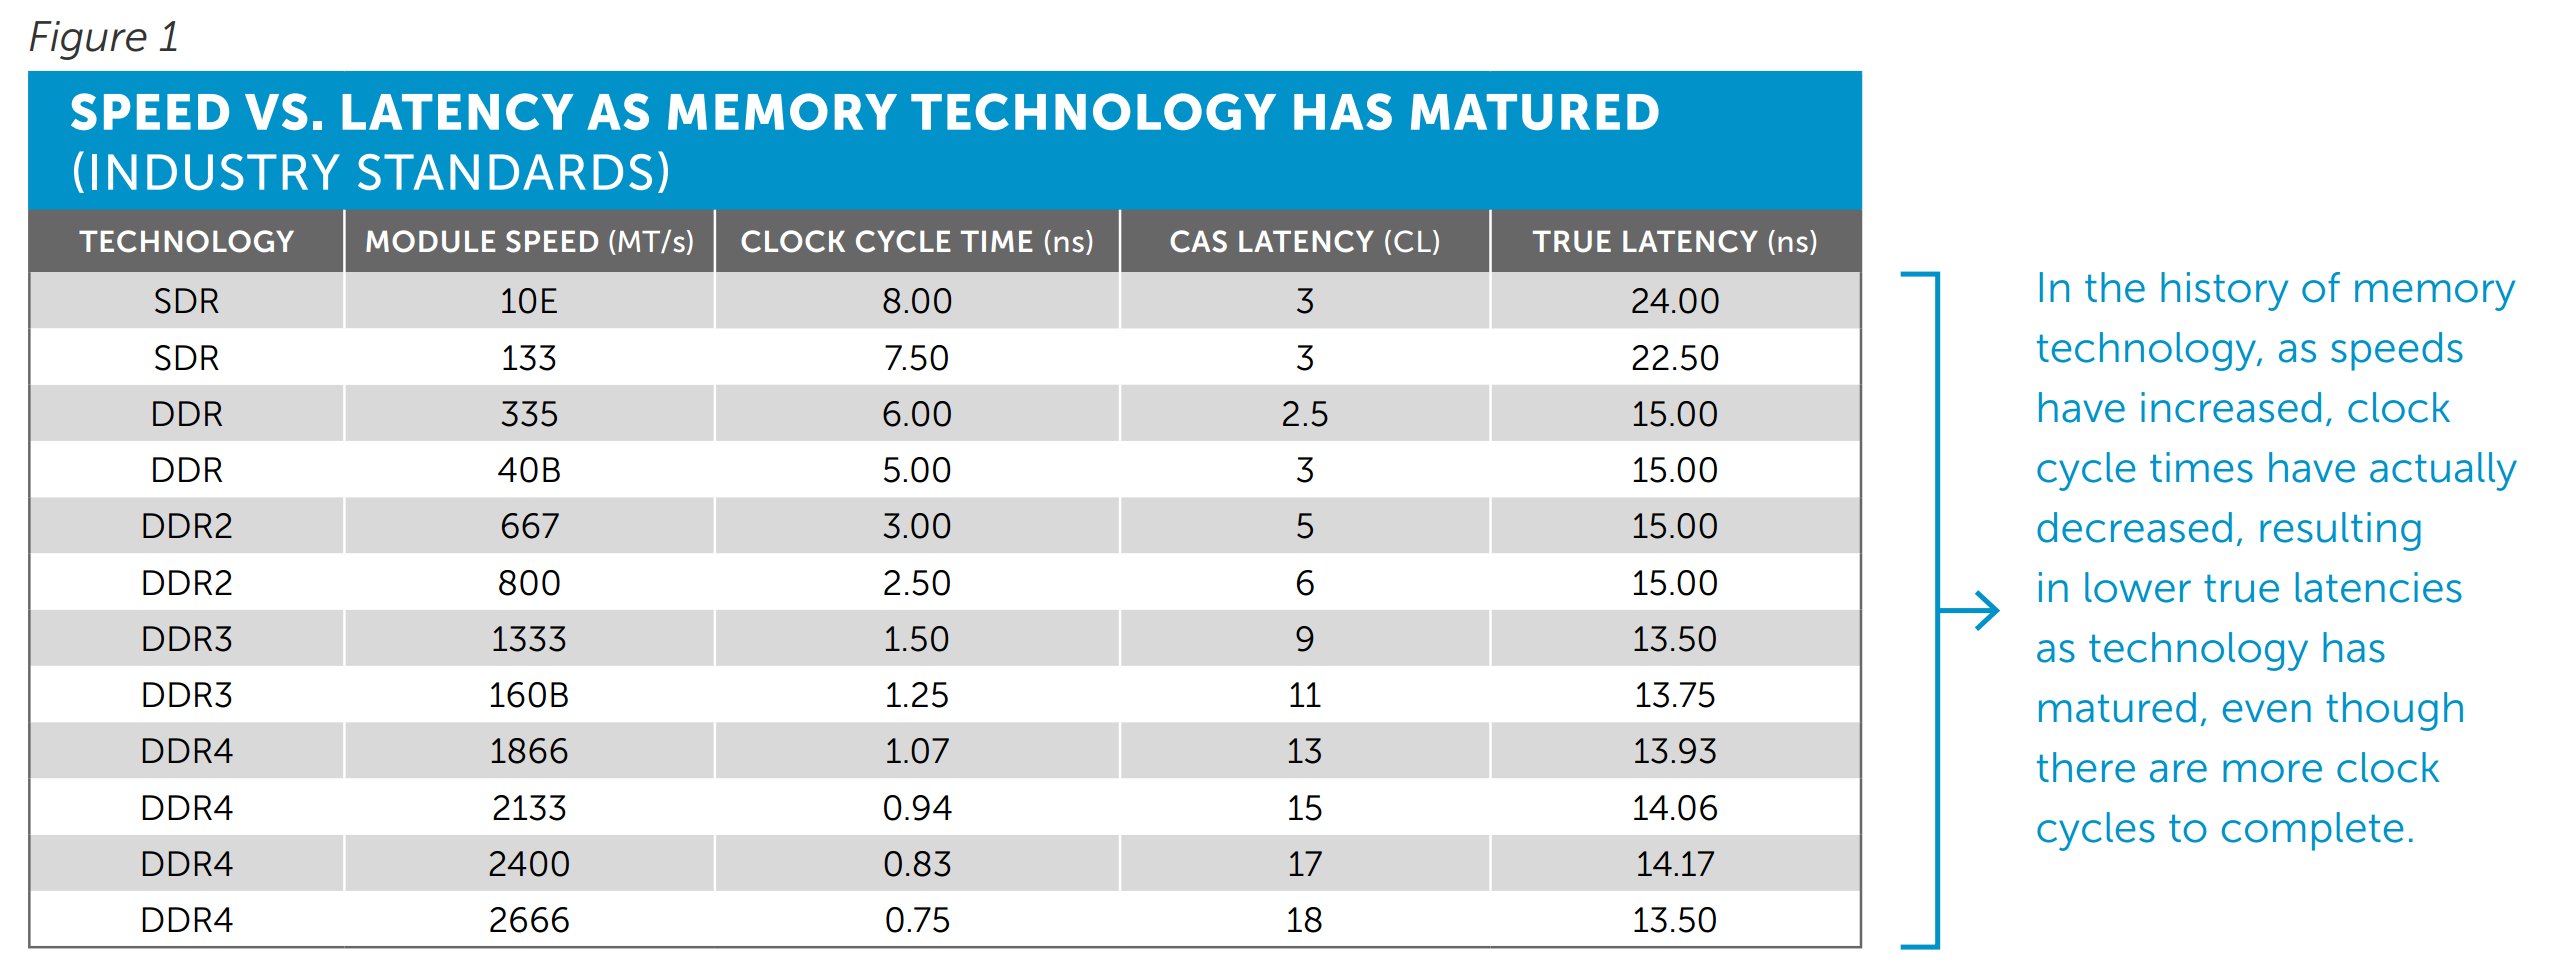
So here we have the values for True Latency:
DDR3-1600 C11: 13.75 nanoseconds
DDR4-2133 C15: 14.06 nanoseconds
In fact despite the development of new memory interfaces, the true latency for DRAM under default specifications has stayed roughly the same since DDR. As we make faster memory modules, the CAS Latency rises to keep higher frequency memory stable, but overall the true latency stays the same.
Normally in our DRAM reviews I refer to the performance index, which has a similar effect in gauging general performance:
DDR3-1600 C11: 1600/11 = 145.5
DDR4-2133 C15: 2133/15 = 142.2
As you have faster memory, you get a bigger number, and if you reduce the CL, we get a bigger number also. Thus for comparing memory kits, if the difference > 10, then the kit with the biggest performance index tends to win out, though for similar kits the one with the highest frequency is preferred.
“But who uses DDR3-1600 C11? Isn’t most memory like DDR3-1866 C9?”
This is valid point – as DDR3 has matured, the number of kits in the market that are running faster than default specifications are actually normal now. The performance index for this kit is:
DDR3-1866 C9: 1866/9 = 207.3
In the grand scheme of things, a PI of 207 is actually quite large, and super high for DDR3L. There are a few DDR3 memory kits that go beyond this up to a PI of 220, or an overclock might go to 240 beyond normal voltages, but a value of 207 shows the maturity of the DDR3 market. If we look at the current DDR4 market, we can pick up kits with DDR4-3000 C15 ratings, which are similarly in the 200 bracket now too.
I’ve prefaced our DDR3L vs DDR4 testing with all this as a response to ‘large CL = bad’. Actually, you have to compare both numbers. Now that we have a platform that runs both, and we were able to source a beta DDR3L/DDR4 combination motherboard to test them on, we can see how it squares up from ‘regular DDR4’ against ‘high performance DDR3(L)’.
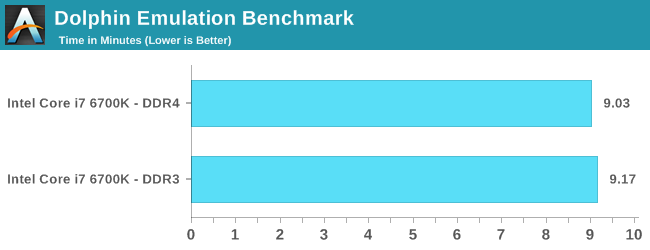
For these tests, both sets of numbers were run at 3.0 GHz with hyperthreading disabled. Memory speeds were DDR4-2133 C15 and DDR3-1866 C9 respectively.
Dolphin Benchmark: link
Many emulators are often bound by single thread CPU performance, and general reports tended to suggest that Haswell provided a significant boost to emulator performance. This benchmark runs a Wii program that raytraces a complex 3D scene inside the Dolphin Wii emulator. Performance on this benchmark is a good proxy of the speed of Dolphin CPU emulation, which is an intensive single core task using most aspects of a CPU. Results are given in minutes, where the Wii itself scores 17.53 minutes.
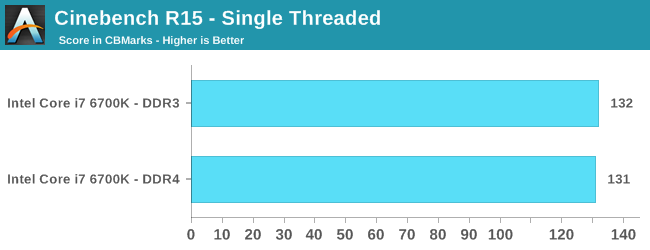
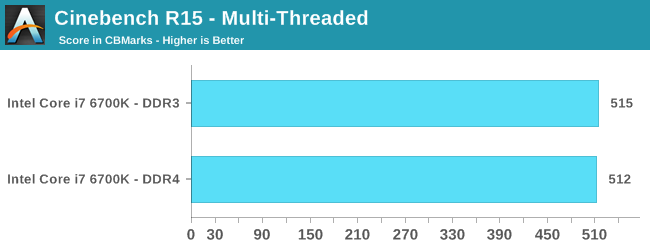
Cinebench R15
Cinebench is a benchmark based around Cinema 4D, and is fairly well known among enthusiasts for stressing the CPU for a provided workload. Results are given as a score, where higher is better.
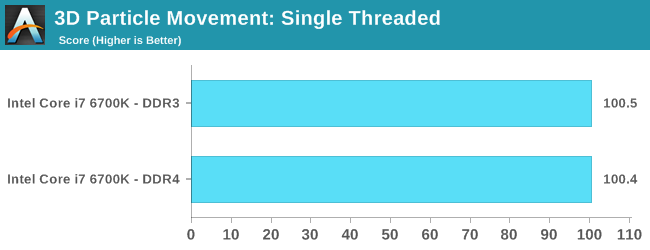
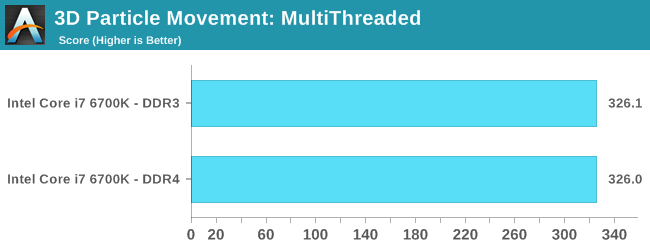
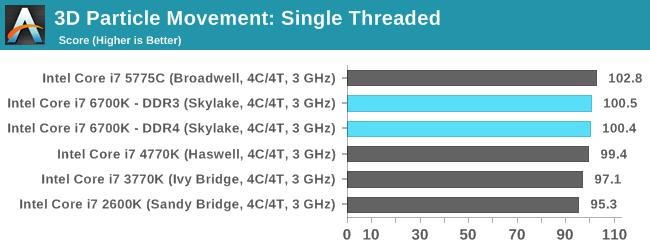
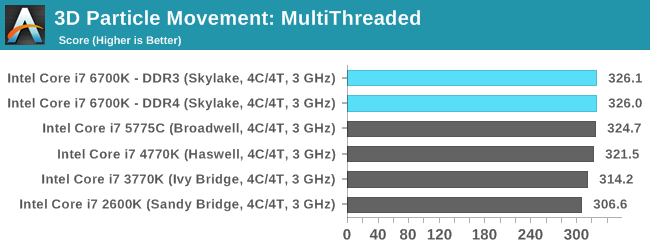
Point Calculations – 3D Movement Algorithm Test: link
3DPM is a self-penned benchmark, taking basic 3D movement algorithms used in Brownian Motion simulations and testing them for speed. High floating point performance, MHz and IPC wins in the single thread version, whereas the multithread version has to handle the threads and loves more cores. For a brief explanation of the platform agnostic coding behind this benchmark, see my forum post here.
Compression – WinRAR 5.0.1: link
Our WinRAR test from 2013 is updated to the latest version of WinRAR at the start of 2014. We compress a set of 2867 files across 320 folders totaling 1.52 GB in size – 95% of these files are small typical website files, and the rest (90% of the size) are small 30 second 720p videos.
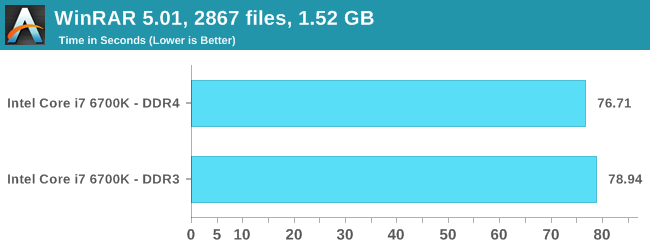
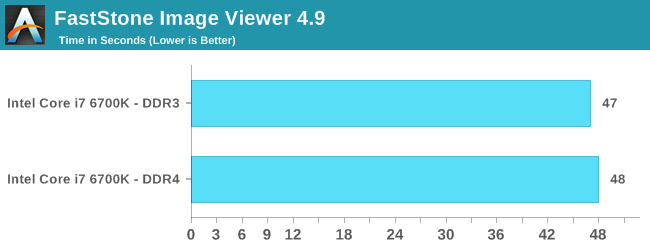
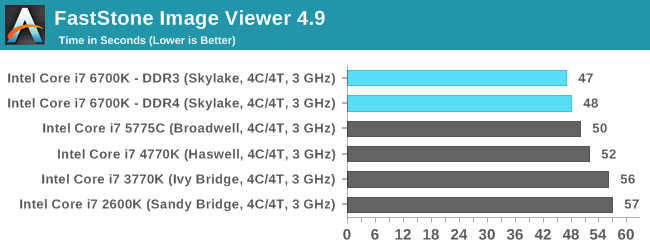
Image Manipulation – FastStone Image Viewer 4.9: link
Similarly to WinRAR, the FastStone test us updated for 2014 to the latest version. FastStone is the program I use to perform quick or bulk actions on images, such as resizing, adjusting for color and cropping. In our test we take a series of 170 images in various sizes and formats and convert them all into 640x480 .gif files, maintaining the aspect ratio. FastStone does not use multithreading for this test, and thus single threaded performance is often the winner.
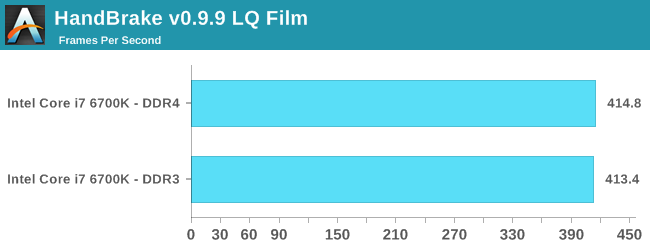
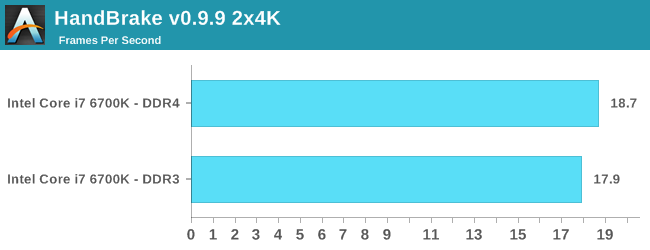
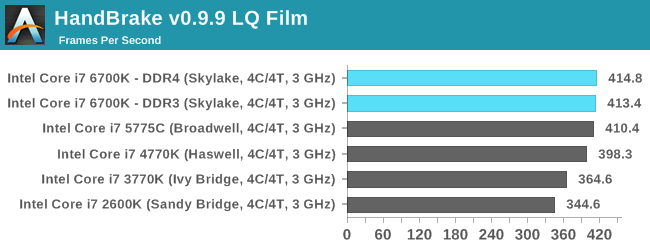
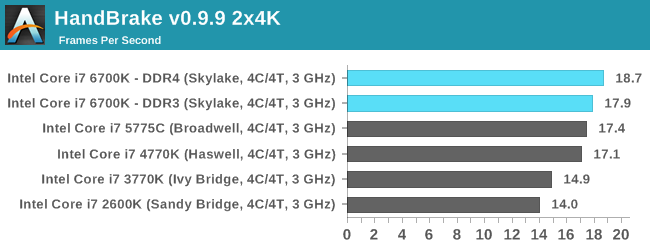
Video Conversion – Handbrake v0.9.9: link
Handbrake is a media conversion tool that was initially designed to help DVD ISOs and Video CDs into more common video formats. The principle today is still the same, primarily as an output for H.264 + AAC/MP3 audio within an MKV container. In our test we use the same videos as in the Xilisoft test, and results are given in frames per second.
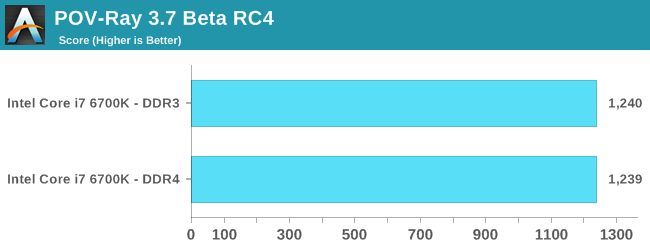
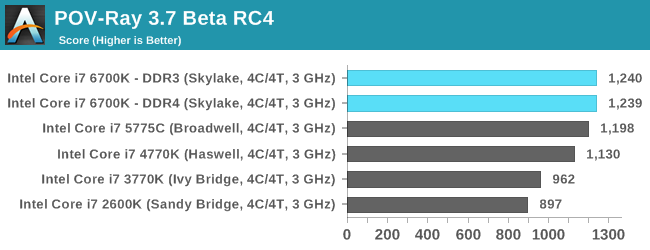
Rendering – PovRay 3.7: link
The Persistence of Vision RayTracer, or PovRay, is a freeware package for as the name suggests, ray tracing. It is a pure renderer, rather than modeling software, but the latest beta version contains a handy benchmark for stressing all processing threads on a platform. We have been using this test in motherboard reviews to test memory stability at various CPU speeds to good effect – if it passes the test, the IMC in the CPU is stable for a given CPU speed. As a CPU test, it runs for approximately 2-3 minutes on high end platforms.
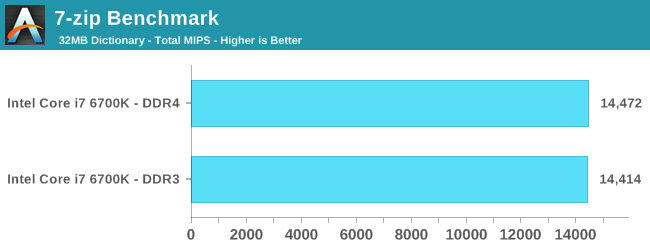
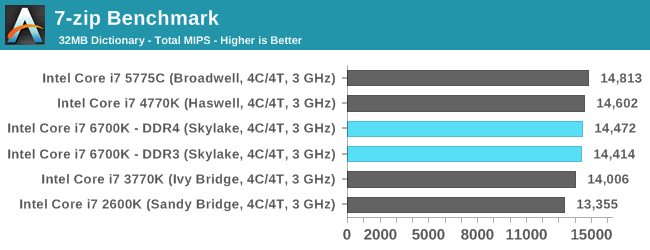
Synthetic – 7-Zip 9.2: link
As an open source compression tool, 7-Zip is a popular tool for making sets of files easier to handle and transfer. The software offers up its own benchmark, to which we report the result.
Overall: DDR4 vs DDR3L on the CPU
Pretty sure the results speak for themselves:
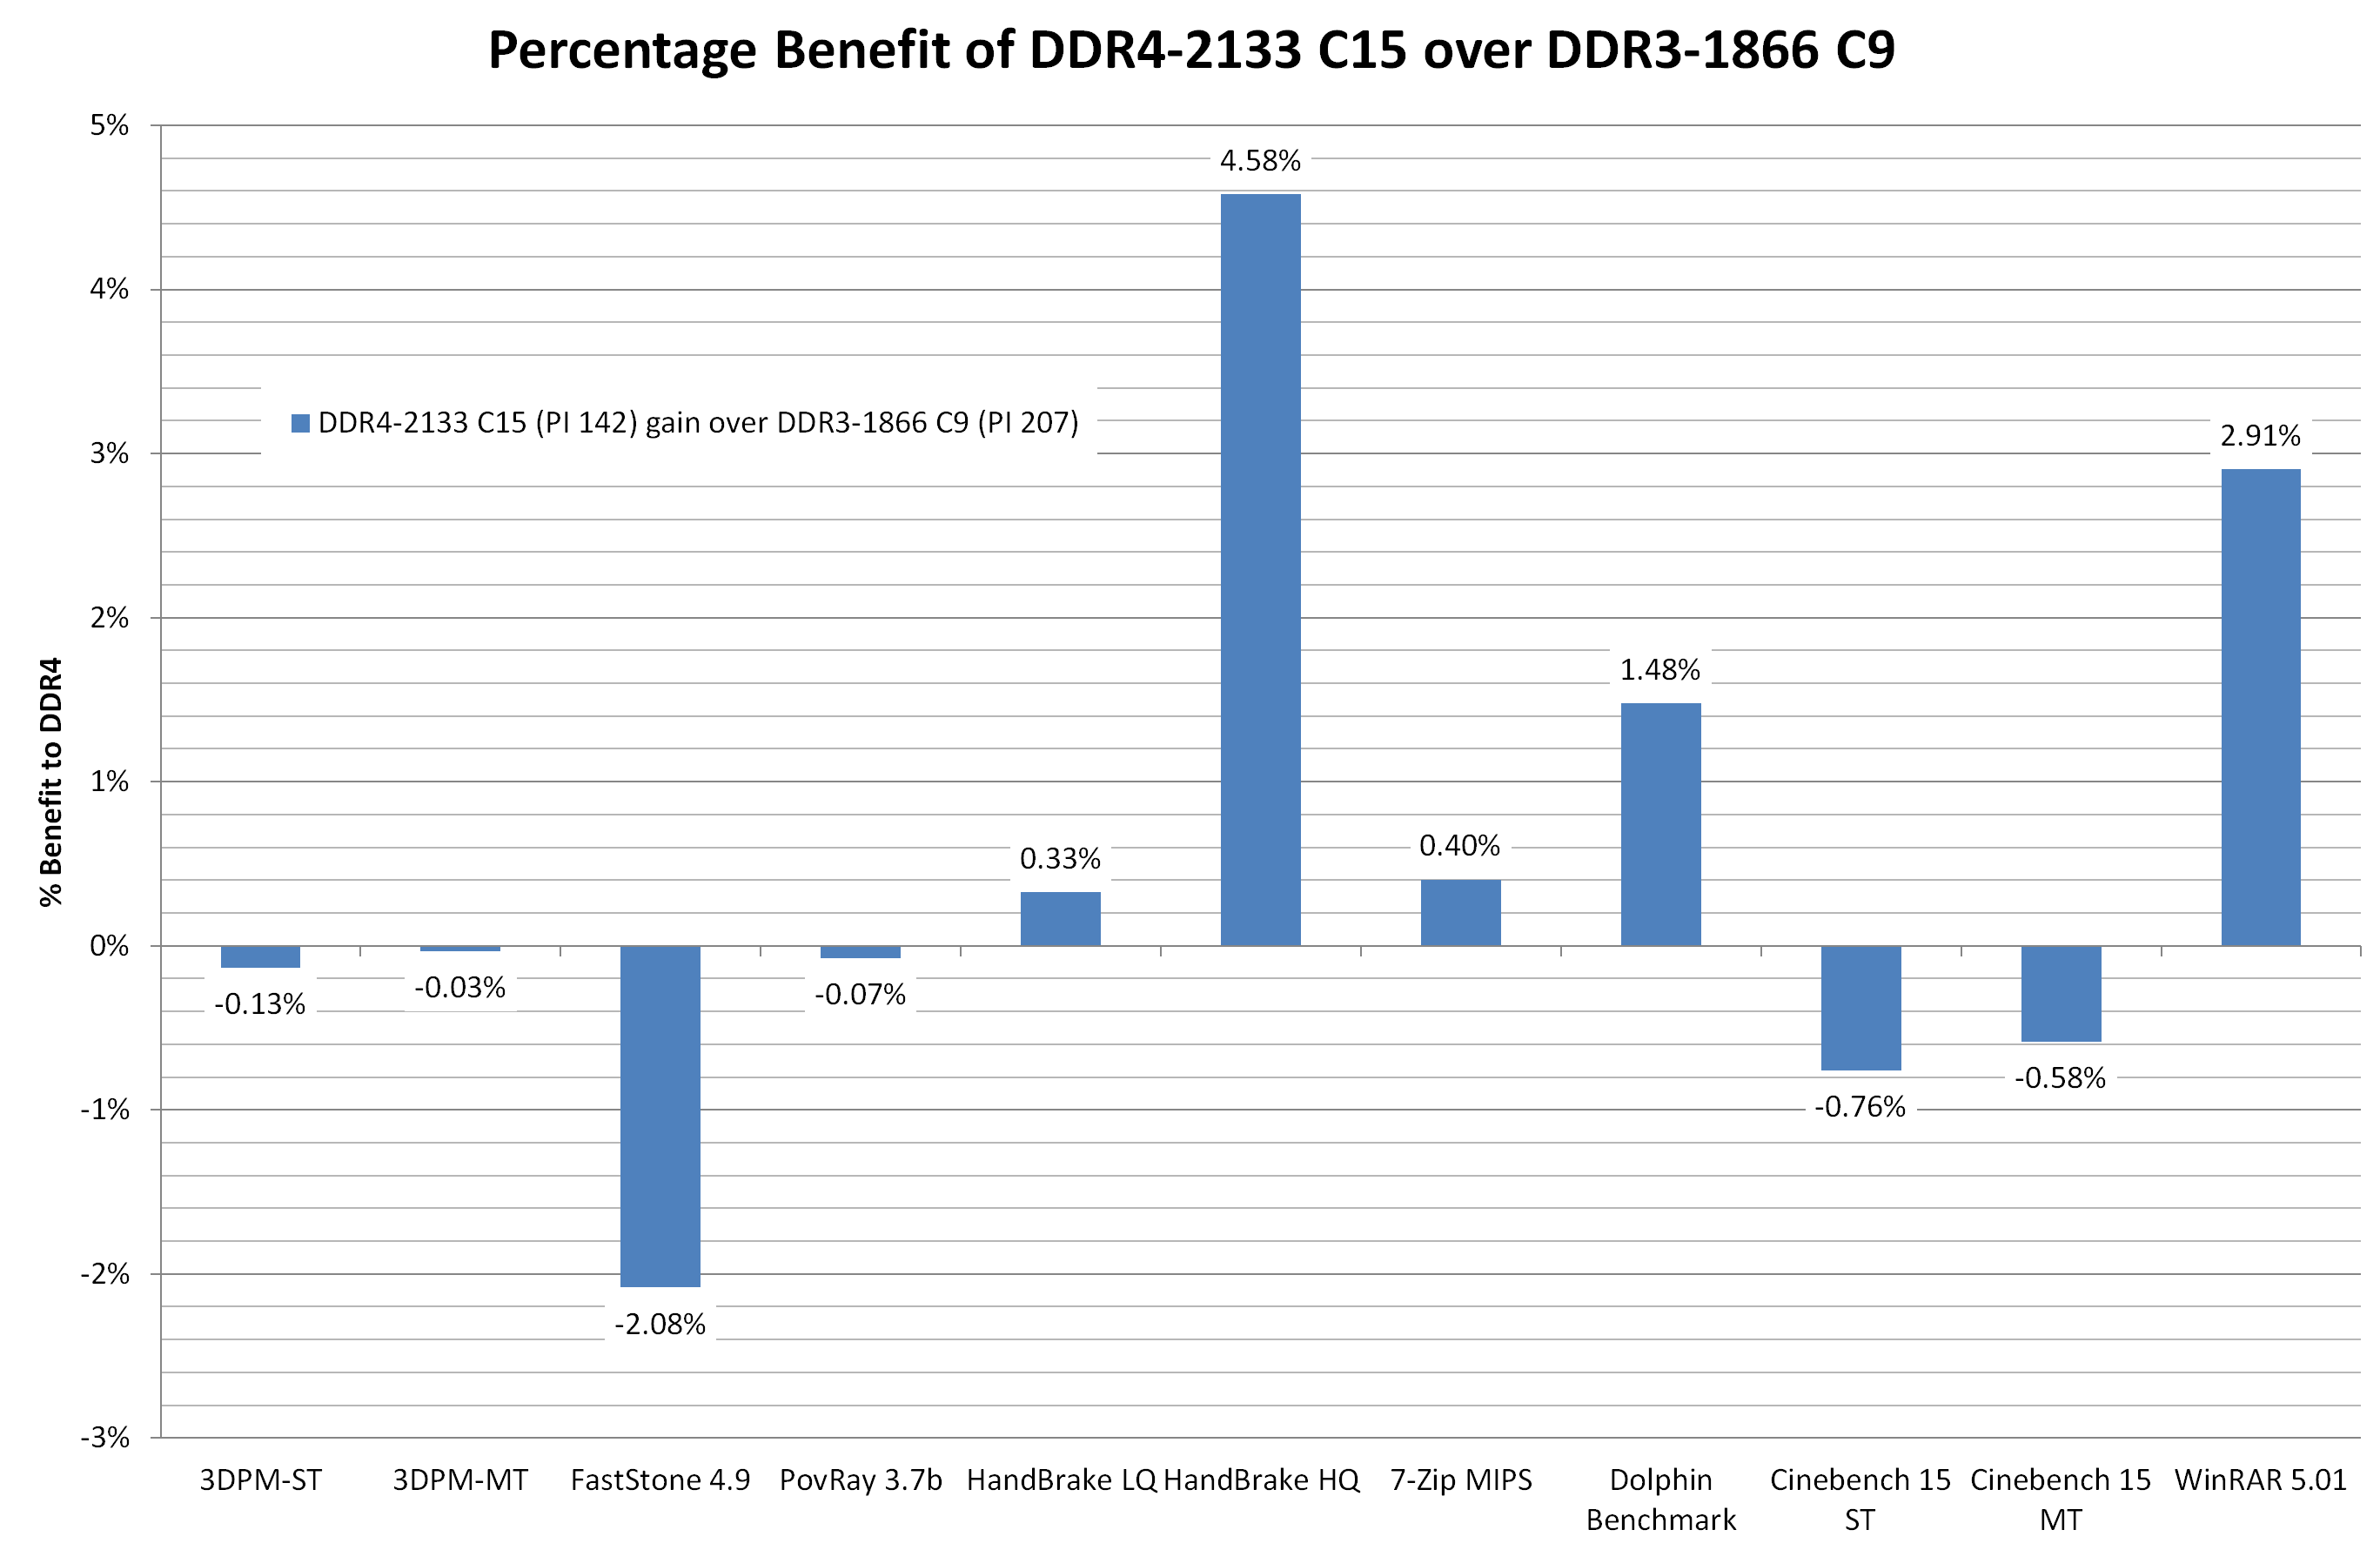
Comparing default DDR4 to a high performance DDR3 memory kit is almost an equal contest. Having the faster frequency helps for large frame video encoding (HandBrake HQ) as well as WinRAR which is normally memory intensive. The only real benchmark loss was FastStone, which regressed by one second (out of 48 seconds).
End result, looking at the CPU test scores, is that upgrading to DDR4 doesn’t degrade performance from your high end DRAM kit, and you get the added benefit of future upgrades, faster speeds, lower power consumption due to the lower voltage and higher density modules.
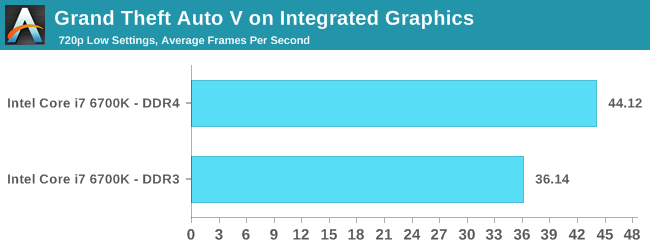
DDR4 vs DDR3L on Gaming
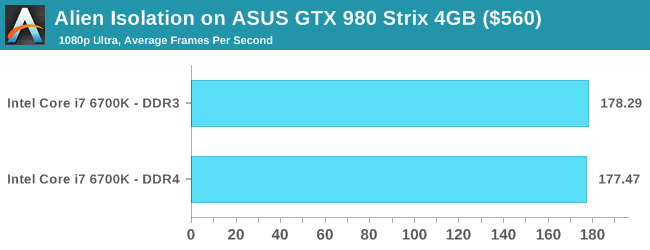
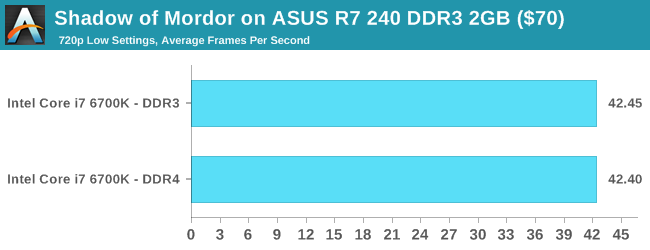
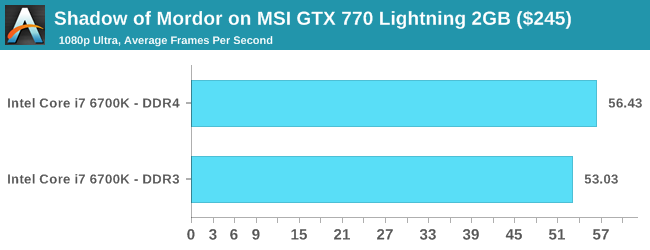
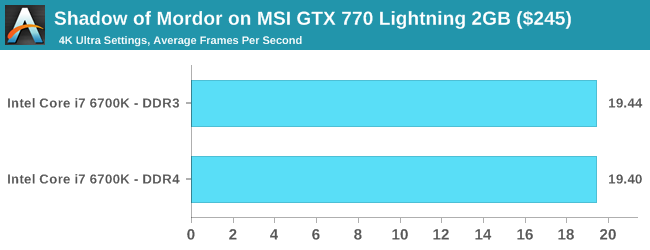
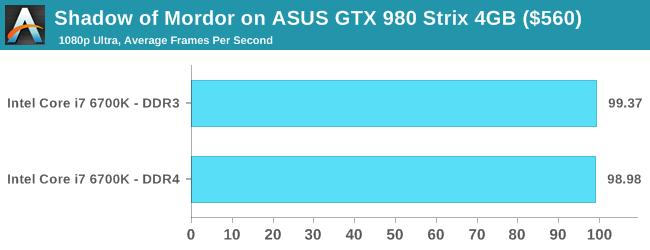
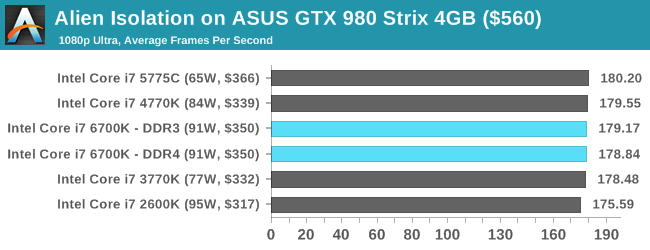
For this set of tests, we kept things simple for the results – a low end single R7 240 DDR3, an ex-high end GTX 770 Lightning and a top line GTX 980 on our standard CPU game set under normal conditions. However it is the integrated results that should throw up the biggest difference.
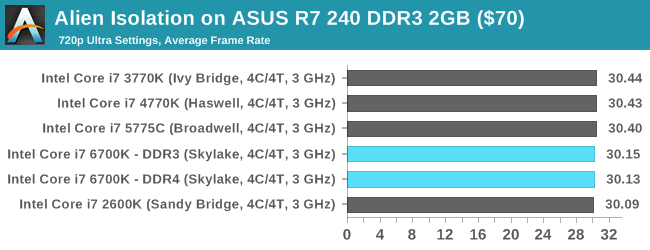
Alien: Isolation
If first person survival mixed with horror is your sort of thing, then Alien: Isolation, based off of the Alien franchise, should be an interesting title. Developed by The Creative Assembly and released in October 2014, Alien: Isolation has won numerous awards from Game Of The Year to several top 10s/25s and Best Horror titles, ratcheting up over a million sales by February 2015. Alien: Isolation uses a custom built engine which includes dynamic sound effects and should be fully multi-core enabled.
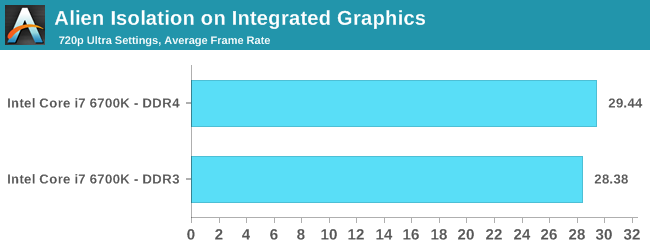
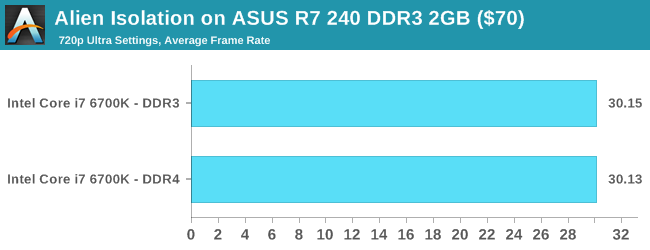
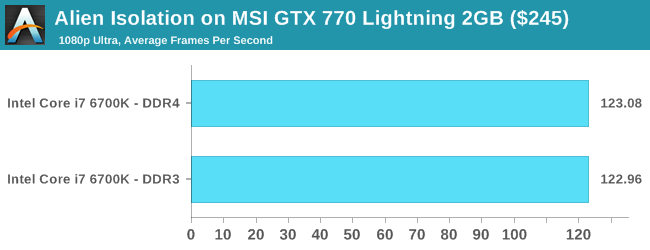
For low end graphics, we test at 720p with Ultra settings, whereas for mid and high range graphics we bump this up to 1080p, taking the average frame rate as our marker with a scripted version of the built-in benchmark.
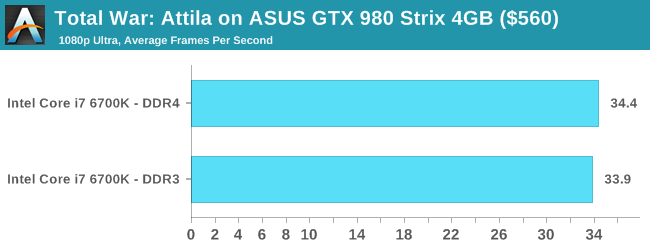
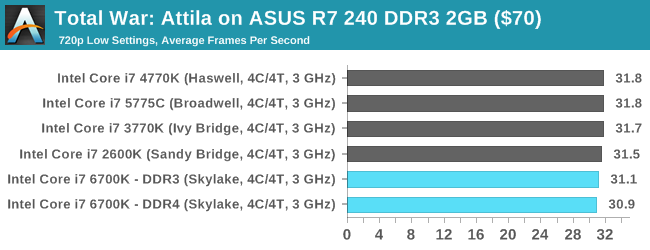
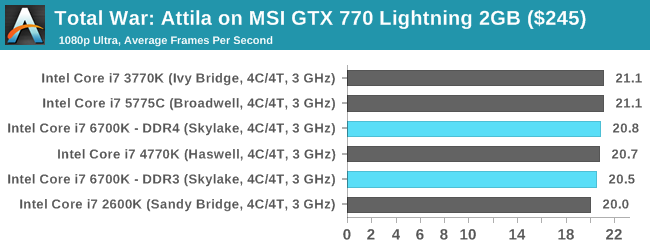
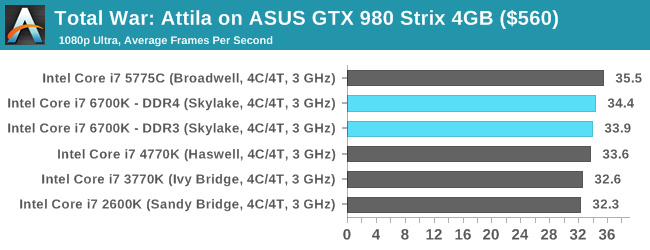
Total War: Attila
The Total War franchise moves on to Attila, another The Creative Assembly development, and is a stand-alone strategy title set in 395AD where the main story line lets the gamer take control of the leader of the Huns in order to conquer parts of the world. Graphically the game can render hundreds/thousands of units on screen at once, all with their individual actions and can put some of the big cards to task.
For low end graphics, we test at 720p with performance settings, recording the average frame rate. With mid and high range graphics, we test at 1080p with the quality setting. In both circumstances, unlimited video memory is enabled and the in-game scripted benchmark is used.

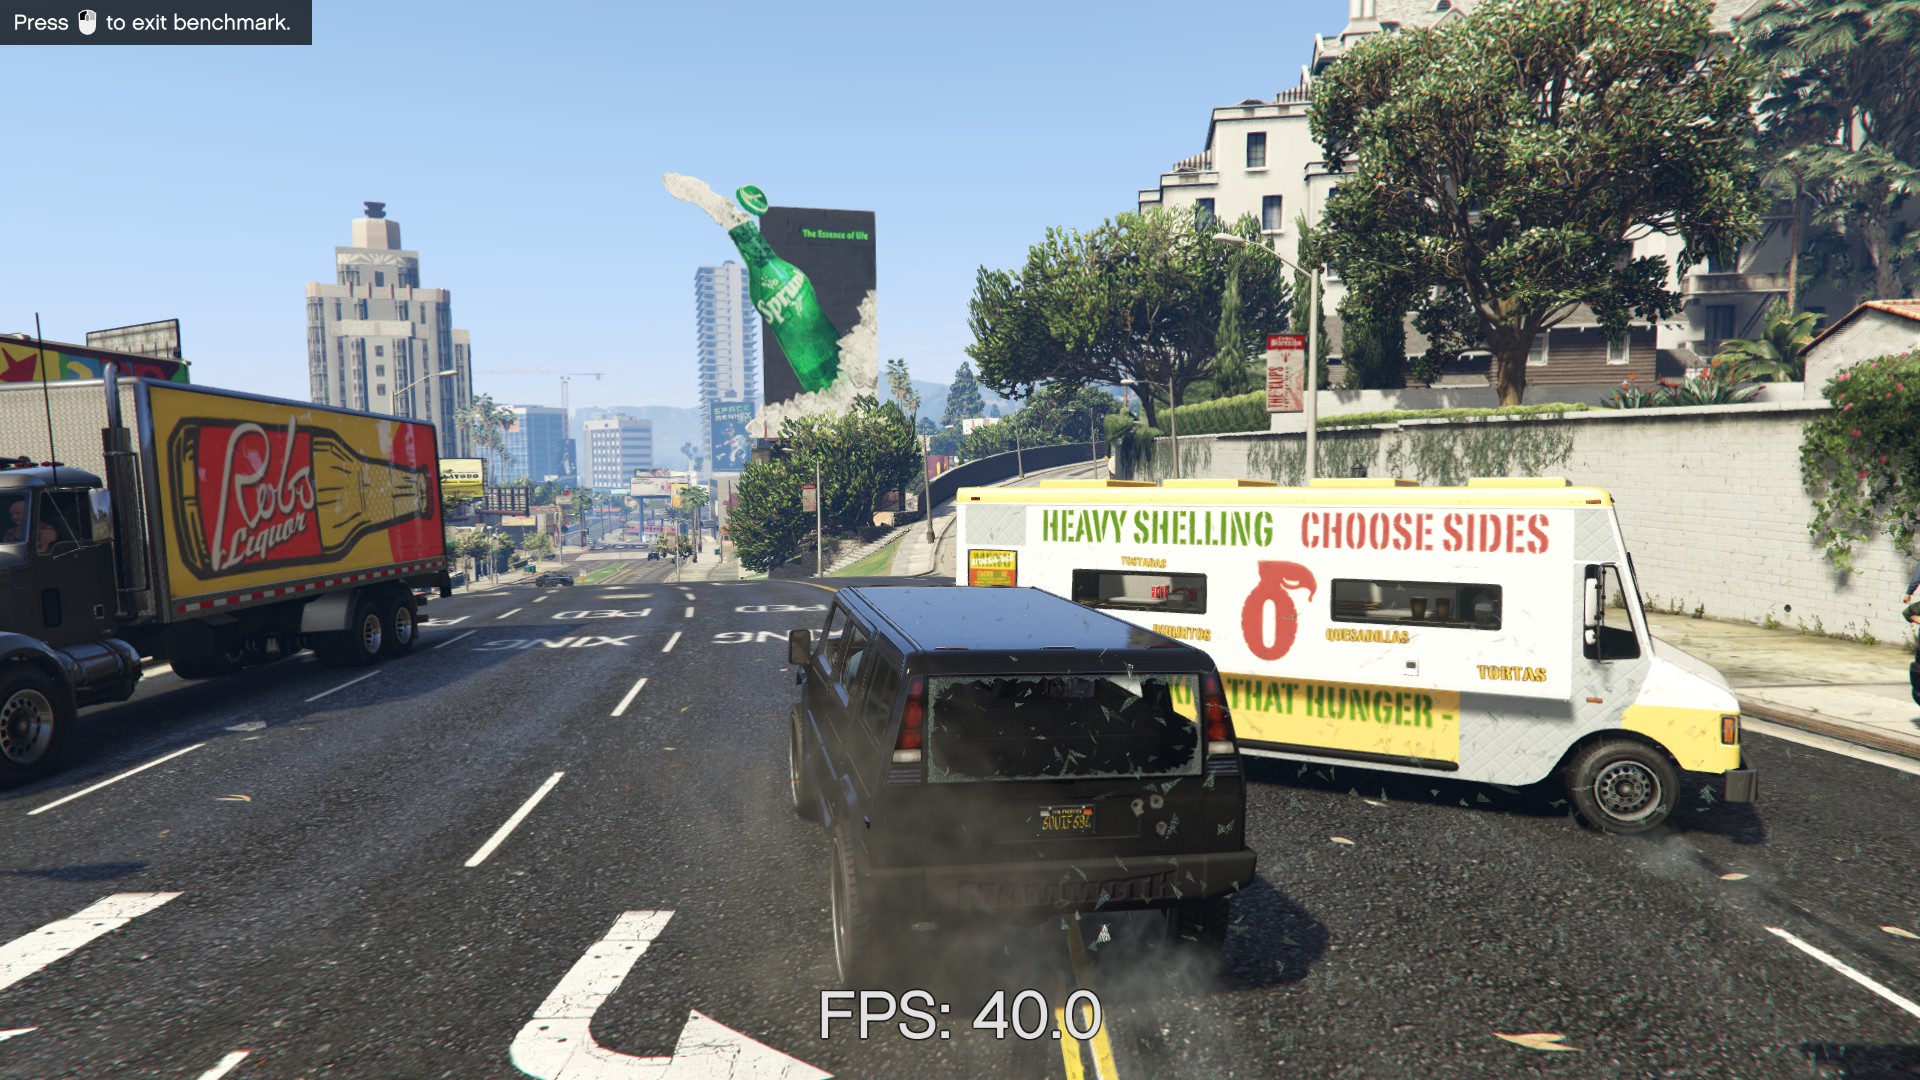
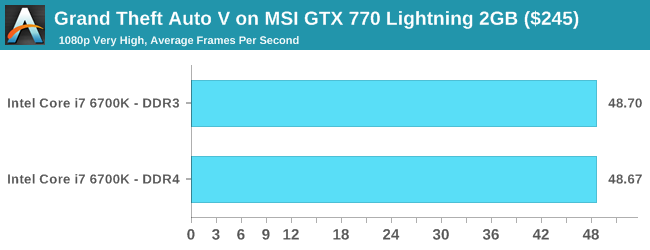
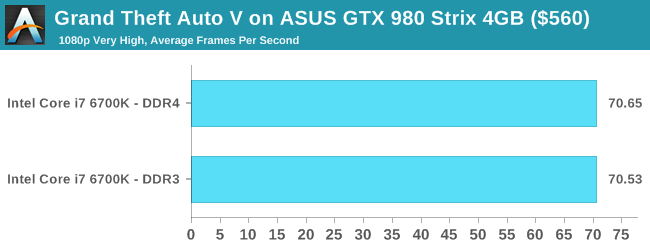
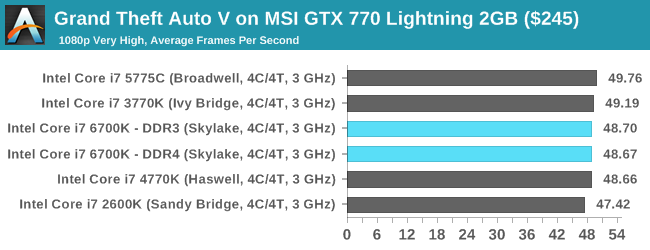
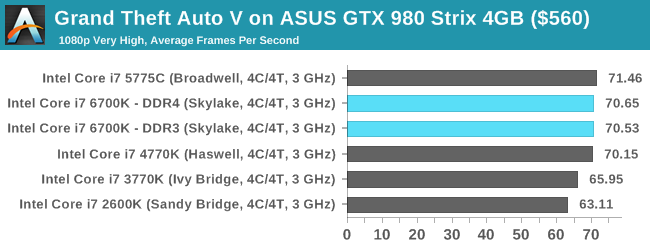
Grand Theft Auto V
The highly anticipated iteration of the Grand Theft Auto franchise finally hit the shelves on April 14th 2015, with both AMD and NVIDIA in tow to help optimize the title. GTA doesn’t provide graphical presets, but opens up the options to users and extends the boundaries by pushing even the hardest systems to the limit using Rockstar’s Advanced Game Engine. Whether the user is flying high in the mountains with long draw distances or dealing with assorted trash in the city, when cranked up to maximum it creates stunning visuals but hard work for both the CPU and the GPU.
For our test we have scripted a version of the in-game benchmark, relying only on the final part which combines a flight scene along with an in-city drive-by followed by a tanker explosion. For low end systems we test at 720p on the lowest settings, whereas mid and high end graphics play at 1080p with very high settings across the board. We record both the average frame rate and the percentage of frames under 60 FPS (16.6ms).
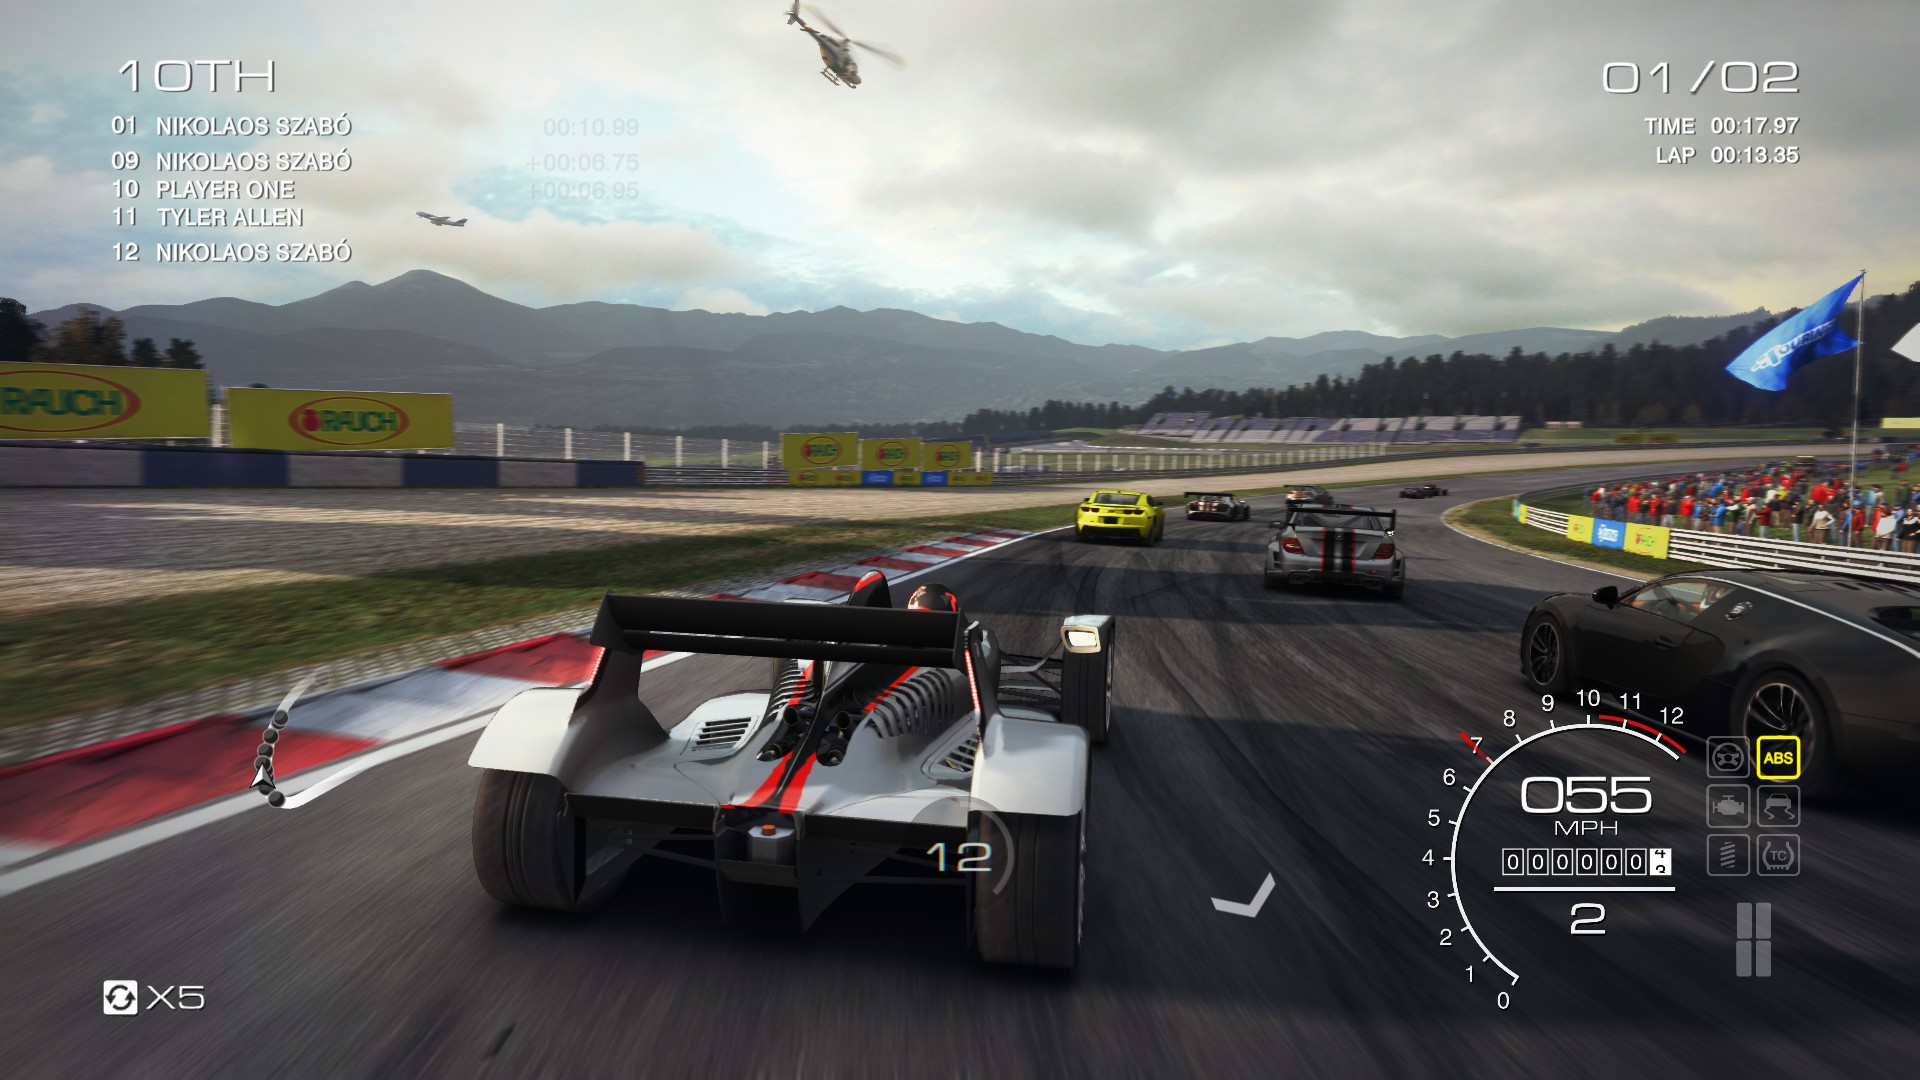
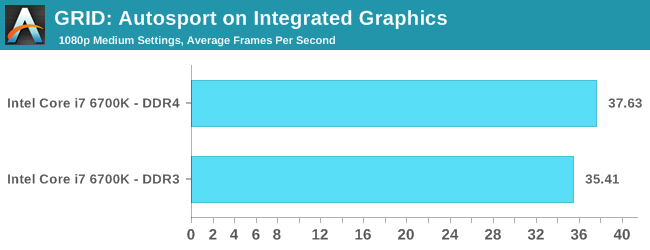
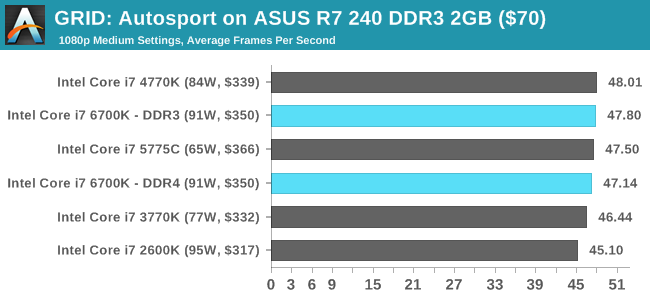
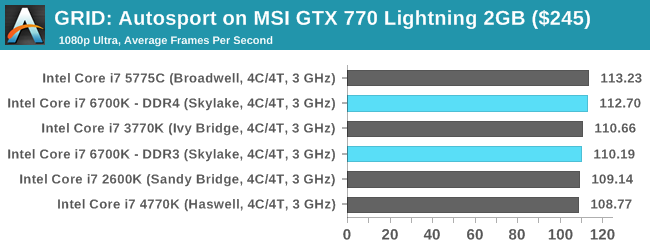
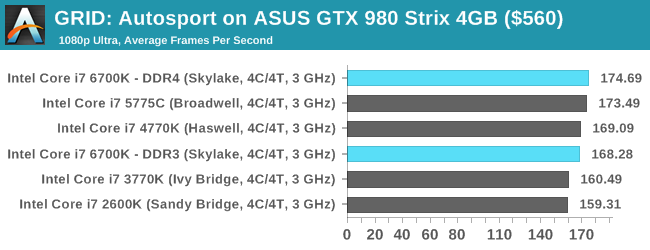
GRID: Autosport
No graphics tests are complete without some input from Codemasters and the EGO engine, which means for this round of testing we point towards GRID: Autosport, the next iteration in the GRID and racing genre. As with our previous racing testing, each update to the engine aims to add in effects, reflections, detail and realism, with Codemasters making ‘authenticity’ a main focal point for this version.
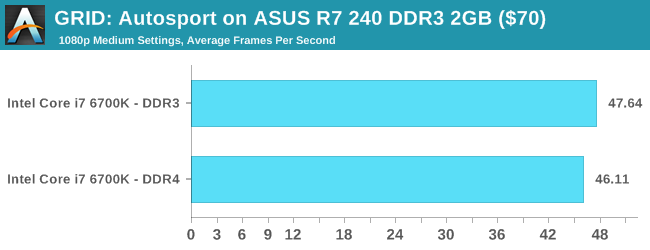
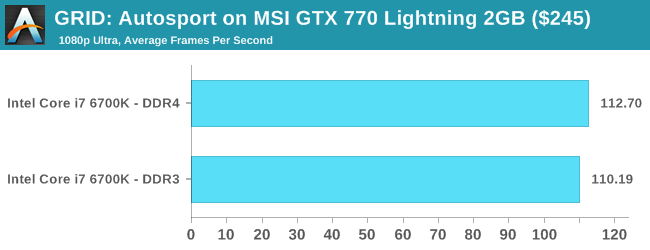
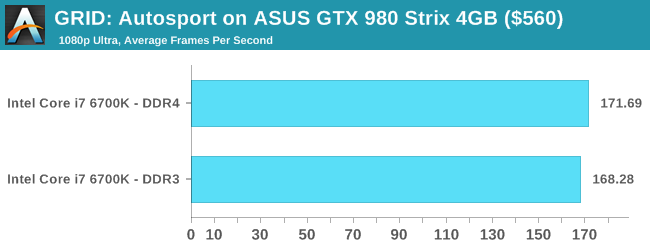
GRID’s benchmark mode is very flexible, and as a result we created a test race using a shortened version of the Red Bull Ring with twelve cars doing two laps. The car is focus starts last and is quite fast, but usually finishes second or third. For low end graphics we test at 1080p medium settings, whereas mid and high end graphics get the full 1080p maximum. Both the average and minimum frame rates are recorded.
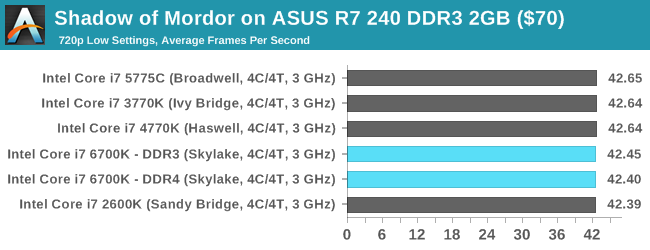
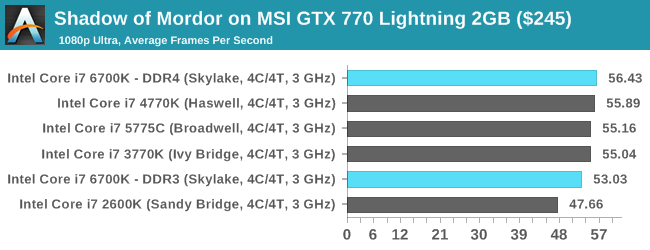
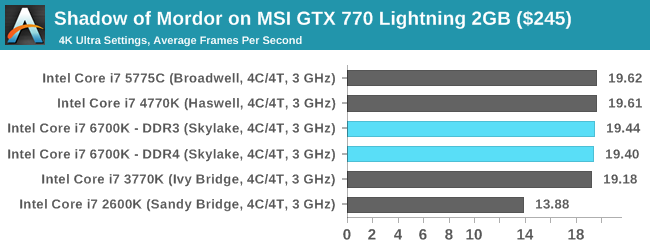
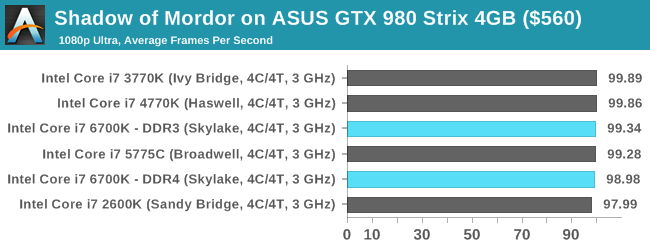
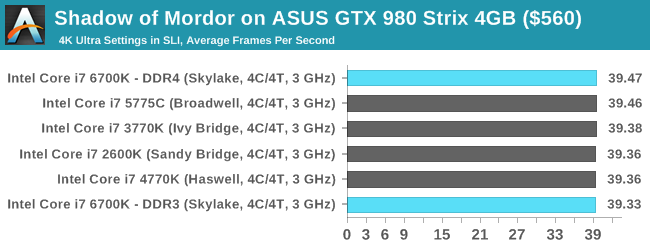
Middle-Earth: Shadow of Mordor
The final title in our testing is another battle of system performance with the open world action-adventure title, Shadow of Mordor. Produced by Monolith using the LithTech Jupiter EX engine and numerous detail add-ons, SoM goes for detail and complexity to a large extent, despite having to be cut down from the original plans. The main story itself was written by the same writer as Red Dead Redemption, and it received Zero Punctuation’s Game of The Year in 2014.
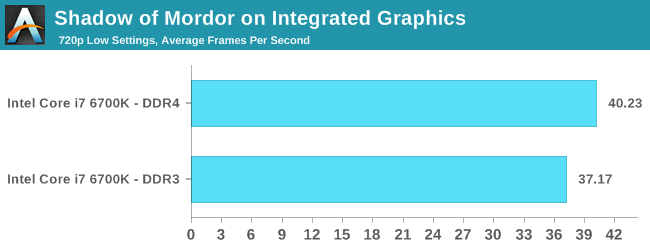
For testing purposes, SoM gives a dynamic screen resolution setting, allowing us to render at high resolutions that are then scaled down to the monitor. As a result, we get several tests using the in-game benchmark. For low end graphics we examine at 720p with low settings, whereas mid and high end graphics get 1080p Ultra. The top graphics test is also redone at 3840x2160, also with Ultra settings, and we also test two cards at 4K where possible.


Conclusions on Gaming, DDR3 vs DDR4
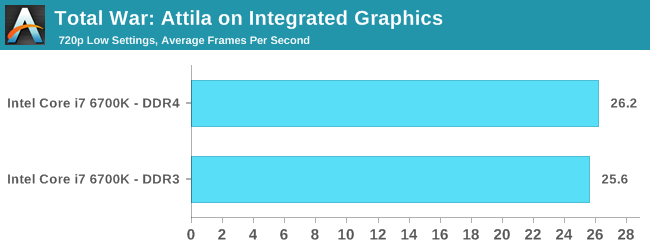
Focusing on purely the integrated graphics, DDR4 is the clear winner with an average 7.0% gain in average frame rates. We also took stock of the minimum frame rates too, and they went up 5.8% as well. So for integrated graphics, moving to even the base DDR4 memory kit wins out.
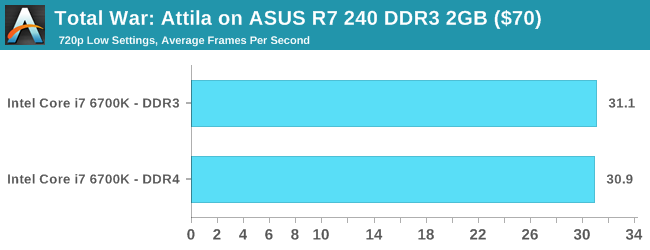
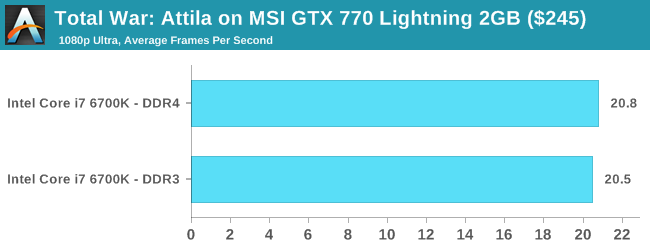
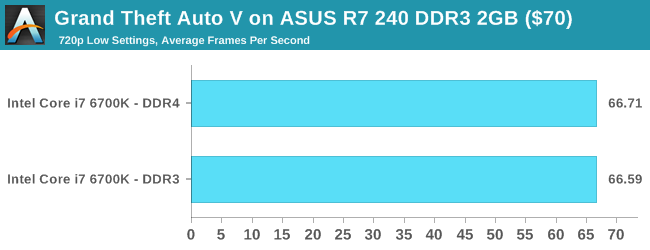
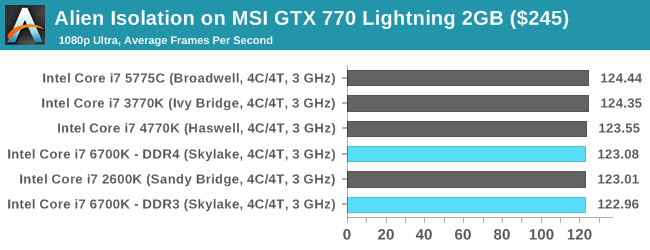
For discrete graphics card testing, only three differences stand out here. For GRID on the R7 240 the DDR4 set loses by 3.2%, but for the GTX 770 the DDR4 wins on Mordor by 6.4% and on GRID by 2.3%. All other differences are below 2%, mostly on the side of DDR4.
Comparing IPC on Skylake: Memory Latency and CPU Benchmarks
The following explanation of IPC has been previously used in our Broadwell review.
Being able to do more with less, in the processor space, allows both the task to be completed quicker and often for less power. While the concept of having devices with multiple cores has allowed many programs to run at once, purely parallel compute such as graphics and most things to run faster, we are all still limited by the fact that a lot of software is still relying on one line of code after another. This is referred to as the serial part of the software, and is the basis for many early programming classes – getting the software to compile and complete is more important than speed. But the truth is that having a few fast cores helps more than several thousand super slow cores. This is where IPC comes in to play.
The principles behind extracting IPC are quite complex as one might imagine. Ideally every instruction a CPU gets should be read, executed and finished in one cycle, however that is never the case. The processor has to take the instruction, decode the instruction, gather the data (depends on where the data is), perform work on the data, then decide what to do with the result. Moving has never been more complicated, and the ability for a processor to hide latency, pre-prepare data by predicting future events or keeping hold of previous events for potential future use is all part of the plan. All the meanwhile there is an external focus on making sure power consumption is low and the frequency of the processor can scale depending on what the target device actually is.
For the most part, Intel has successfully increased IPC every generation of processor. In most cases, 5-10% with a node change and 5-25% with an architecture change with the most recent large jumps being with the Core architecture and the Sandy Bridge architectures, ushering in new waves of super-fast computational power. As Broadwell to Skylake is an architecture change with what should be large updates, we should expect some good gains.
| Intel Desktop Processor Cache Comparison | |||||
| L1-D | L1-I | L2 | L3 | L4 | |
| Sandy Bridge i7 | 4 x 32 KB | 4 x 32 KB | 4 x 256 KB | 8 MB | |
| Ivy Bridge i7 | 4 x 32 KB | 4 x 32 KB | 4 x 256 KB | 8 MB | |
| Haswell i7 | 4 x 32 KB | 4 x 32 KB | 4 x 256 KB | 8 MB | |
| Broadwell i7 (Desktop / Iris Pro 6200) |
4 x 32 KB | 4 x 32 KB | 4 x 256 KB | 6 MB | 128 MB eDRAM |
| Skylake i7 | 4 x 32 KB | 4 x 32 KB | 4 x 256 KB | 8 MB | |
For this test we took Intel’s most recent high-end i7 processors from the last five generations and set them to 3.0 GHz and with HyperThreading disabled. As each platform uses DDR3, we set the memory across each to DDR3-1866 with a CAS latency of 9. For Skylake we also run at DDR4-2133 C15 as a default speed. From a pure cache standpoint, here is how each of the processors performed:
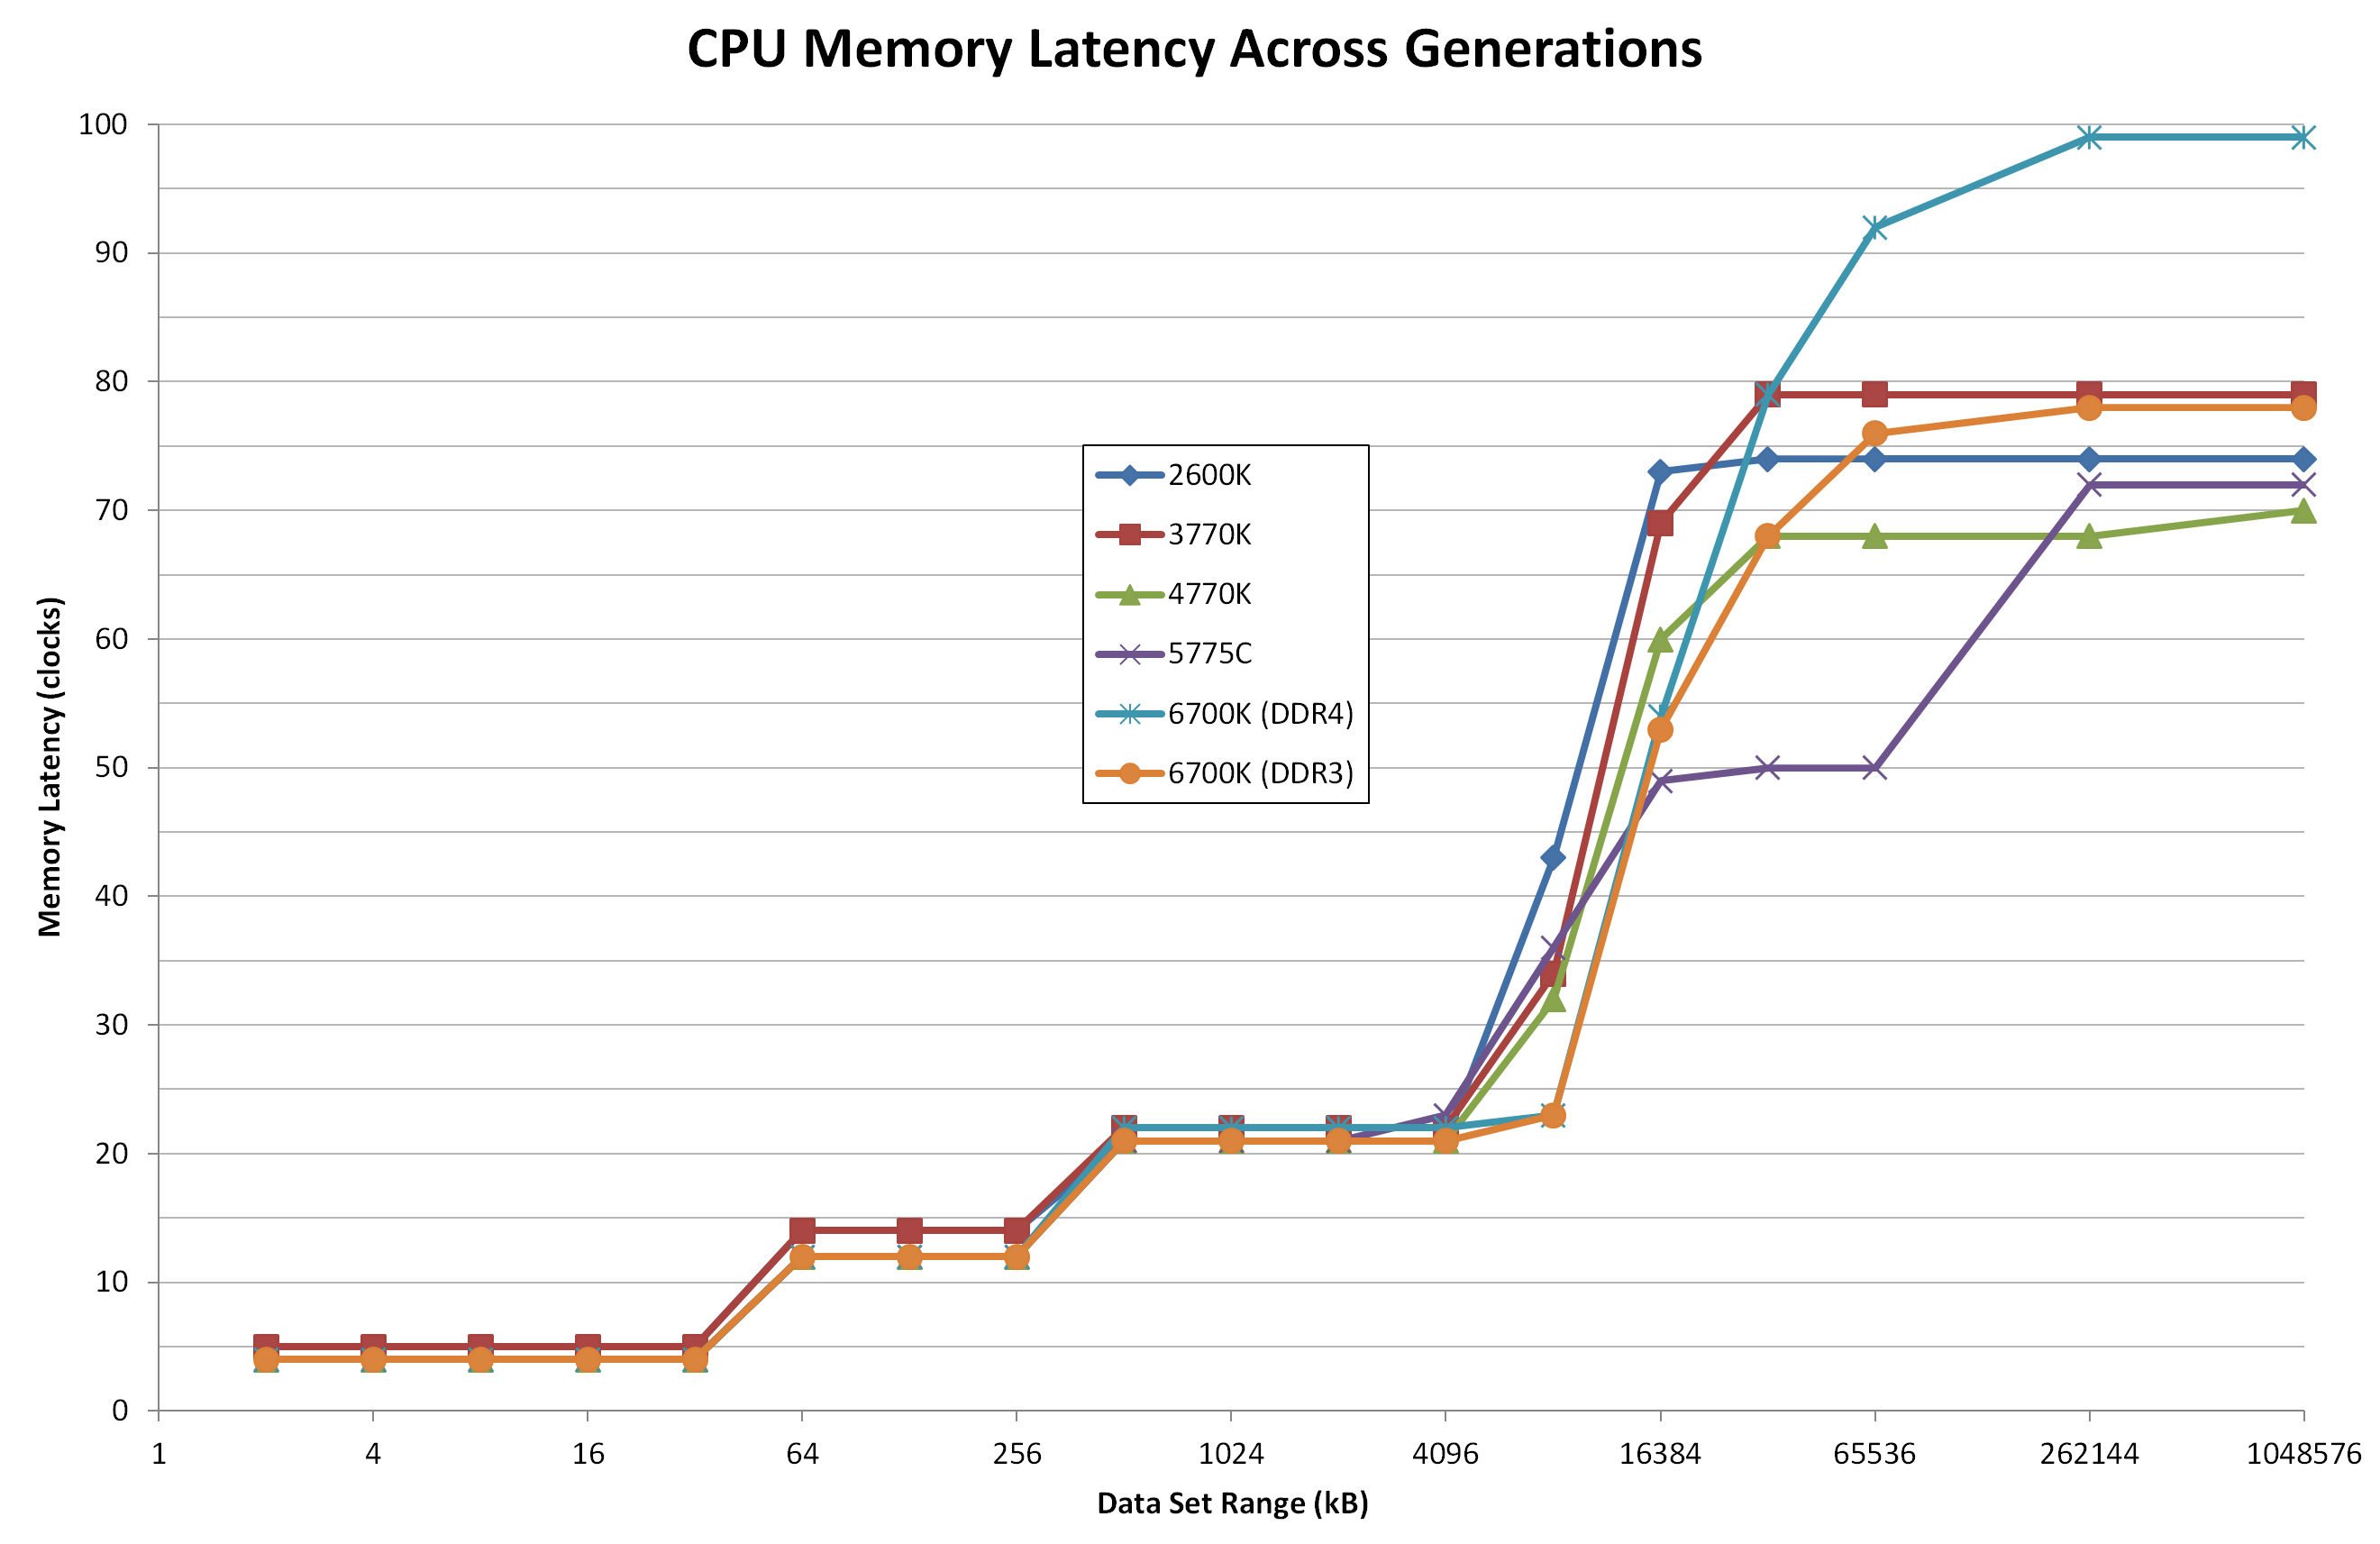
If we ignore Broadwell and its eDRAM, the purple line, especially from 16MB to 128MB, both of the lines for Skylake stay at the low latencies until 4MB. Between 4MB and 8MB, the cache latency still seems to be substantially lower than that of the previous generations.
Normally in this test, despite all of the CPUs having 8MB of L3 cache, the 8MB test has to spill out to main memory because some of the cache is already filled. If you have a more efficient caching and pre-fetch algorithm here, then the latency ‘at 8MB’ will be lower. So an update for Skylake, as shown in both the DDR4 and DDR3 results, is that the L3 caching algorithms or hardware resources have been upgraded.
At this point I would also compare the DDR3 to DDR4 results on Skylake above 16MB. It seems that the latency in this region is a lot higher than the others, showing nearly 100 clocks as we move up to 1GB. But it is worth remembering that these tests are against a memory clock of 2133 MHz, whereas the others are at 1866 MHz. As a result, the two lines are more or less equal in terms of absolute time, as we would expect.
Here are the generational CPU results at 3.0 GHz:
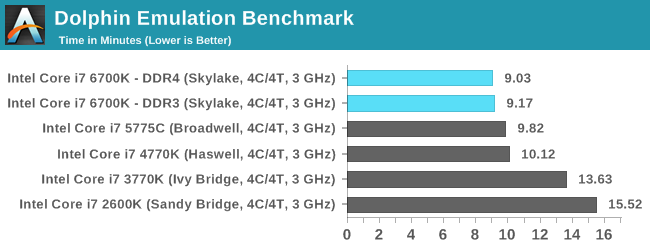
Dolphin Benchmark: link
Many emulators are often bound by single thread CPU performance, and general reports tended to suggest that Haswell provided a significant boost to emulator performance. This benchmark runs a Wii program that raytraces a complex 3D scene inside the Dolphin Wii emulator. Performance on this benchmark is a good proxy of the speed of Dolphin CPU emulation, which is an intensive single core task using most aspects of a CPU. Results are given in minutes, where the Wii itself scores 17.53 minutes.
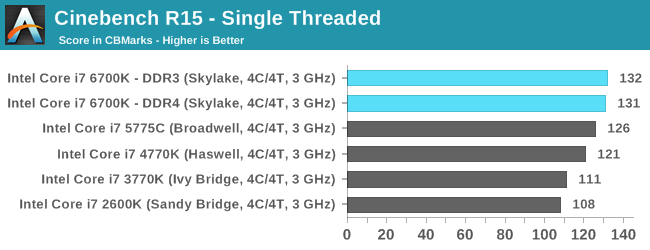
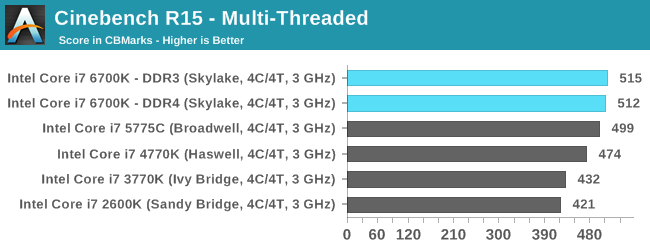
Cinebench R15
Cinebench is a benchmark based around Cinema 4D, and is fairly well known among enthusiasts for stressing the CPU for a provided workload. Results are given as a score, where higher is better.
Point Calculations – 3D Movement Algorithm Test: link
3DPM is a self-penned benchmark, taking basic 3D movement algorithms used in Brownian Motion simulations and testing them for speed. High floating point performance, MHz and IPC wins in the single thread version, whereas the multithread version has to handle the threads and loves more cores. For a brief explanation of the platform agnostic coding behind this benchmark, see my forum post here.
Compression – WinRAR 5.0.1: link
Our WinRAR test from 2013 is updated to the latest version of WinRAR at the start of 2014. We compress a set of 2867 files across 320 folders totaling 1.52 GB in size – 95% of these files are small typical website files, and the rest (90% of the size) are small 30 second 720p videos.
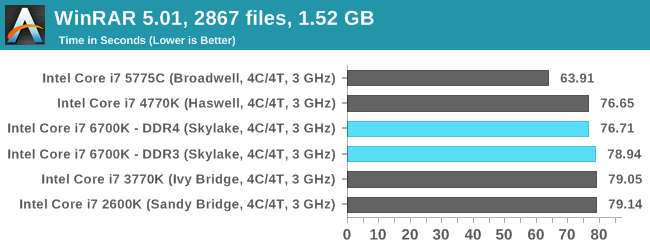
Image Manipulation – FastStone Image Viewer 4.9: link
Similarly to WinRAR, the FastStone test us updated for 2014 to the latest version. FastStone is the program I use to perform quick or bulk actions on images, such as resizing, adjusting for color and cropping. In our test we take a series of 170 images in various sizes and formats and convert them all into 640x480 .gif files, maintaining the aspect ratio. FastStone does not use multithreading for this test, and thus single threaded performance is often the winner.
Video Conversion – Handbrake v0.9.9: link
Handbrake is a media conversion tool that was initially designed to help DVD ISOs and Video CDs into more common video formats. The principle today is still the same, primarily as an output for H.264 + AAC/MP3 audio within an MKV container. In our test we use the same videos as in the Xilisoft test, and results are given in frames per second.
Rendering – PovRay 3.7: link
The Persistence of Vision RayTracer, or PovRay, is a freeware package for as the name suggests, ray tracing. It is a pure renderer, rather than modeling software, but the latest beta version contains a handy benchmark for stressing all processing threads on a platform. We have been using this test in motherboard reviews to test memory stability at various CPU speeds to good effect – if it passes the test, the IMC in the CPU is stable for a given CPU speed. As a CPU test, it runs for approximately 2-3 minutes on high end platforms.
Synthetic – 7-Zip 9.2: link
As an open source compression tool, 7-Zip is a popular tool for making sets of files easier to handle and transfer. The software offers up its own benchmark, to which we report the result.
Overall: CPU IPC
Removing WinRAR as a benchmark because it gets boosted by the eDRAM in Broadwell, we get an interesting look at how each generation has evolved over time. Taking Sandy Bridge (i7-2600K) as the base, we have the following:
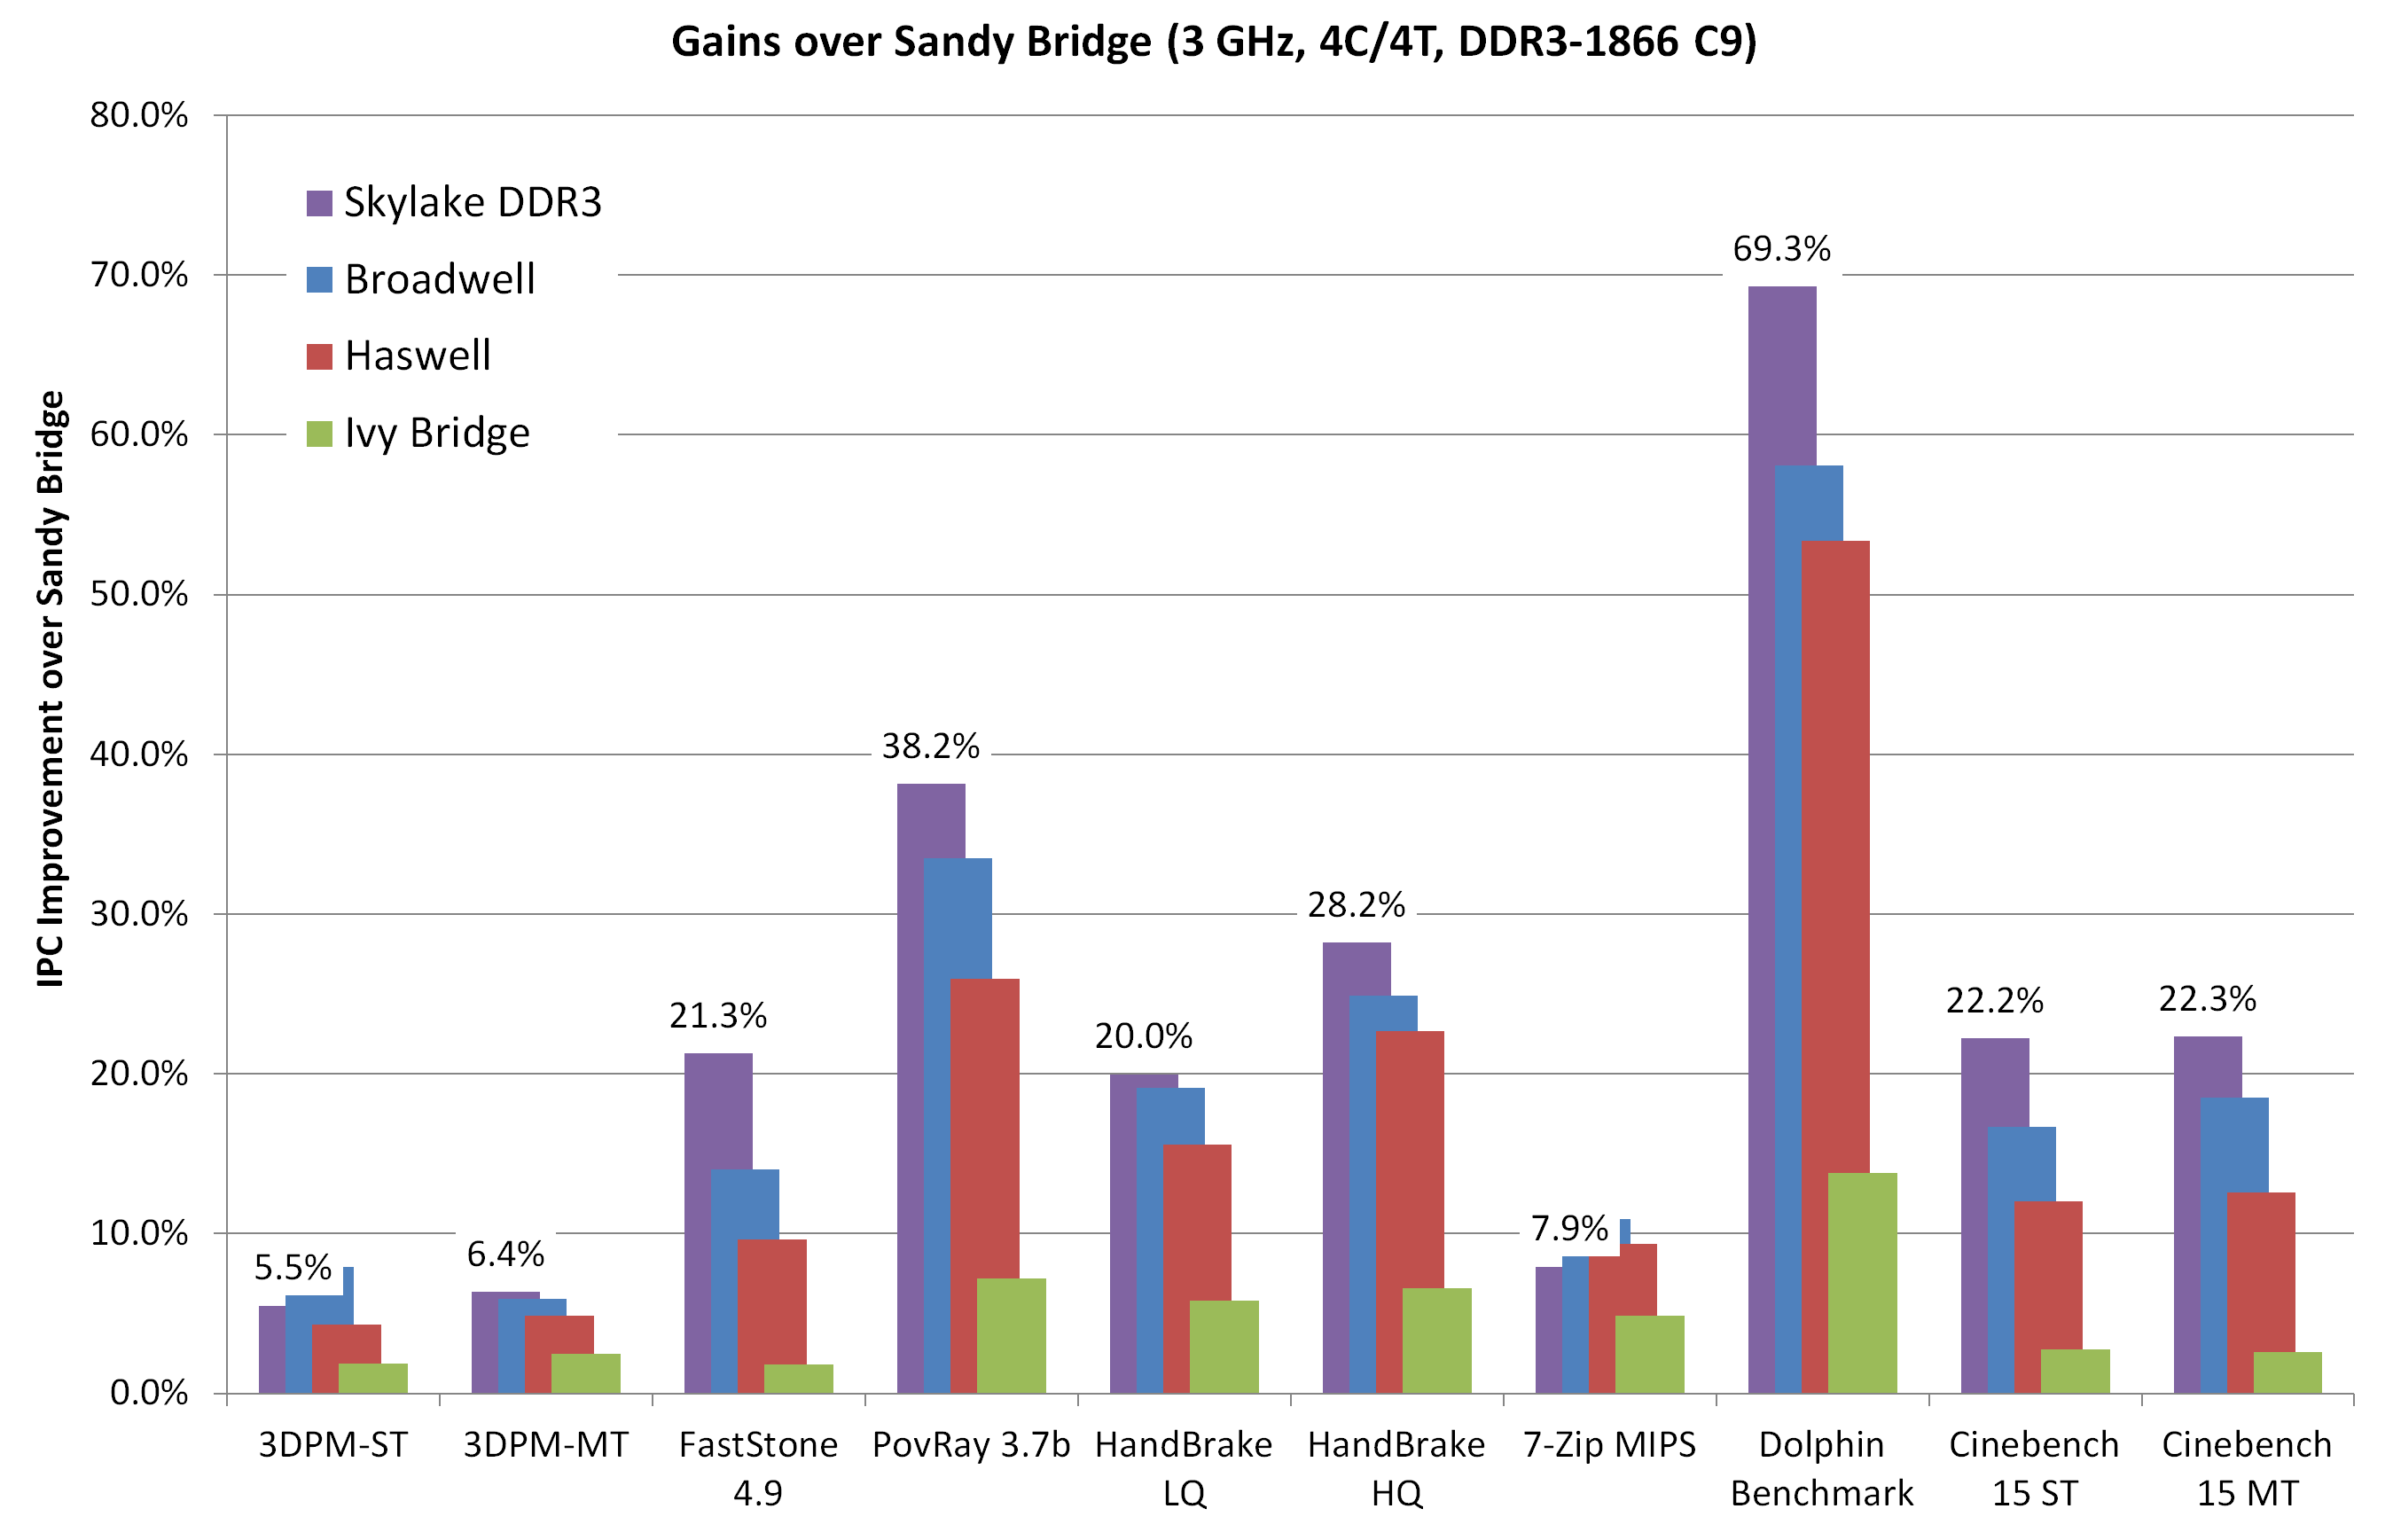
From a pure upgrade perspective, the IPC gain here for Skylake does not look great. In fact in two benchmarks the IPC seems to have decreased – 3DPM in single thread mode and 7-ZIP. What makes 3DPM interesting is that the multithread version still has some improvement at least, if only minor. This difference between MT and ST is more nuanced than first appearances suggest. Throughout the testing, it was noticeable that multithreaded results seem to (on average) get a better kick out of the IPC gain than single threaded. If this is true, it would suggest that Intel has somehow improved its thread scheduler or offered new internal hardware to deal with thread management. We’ll probably find out more at IDF later in the year.
If we adjust this graph to show generation to generation improvement and include the DDR4 results:
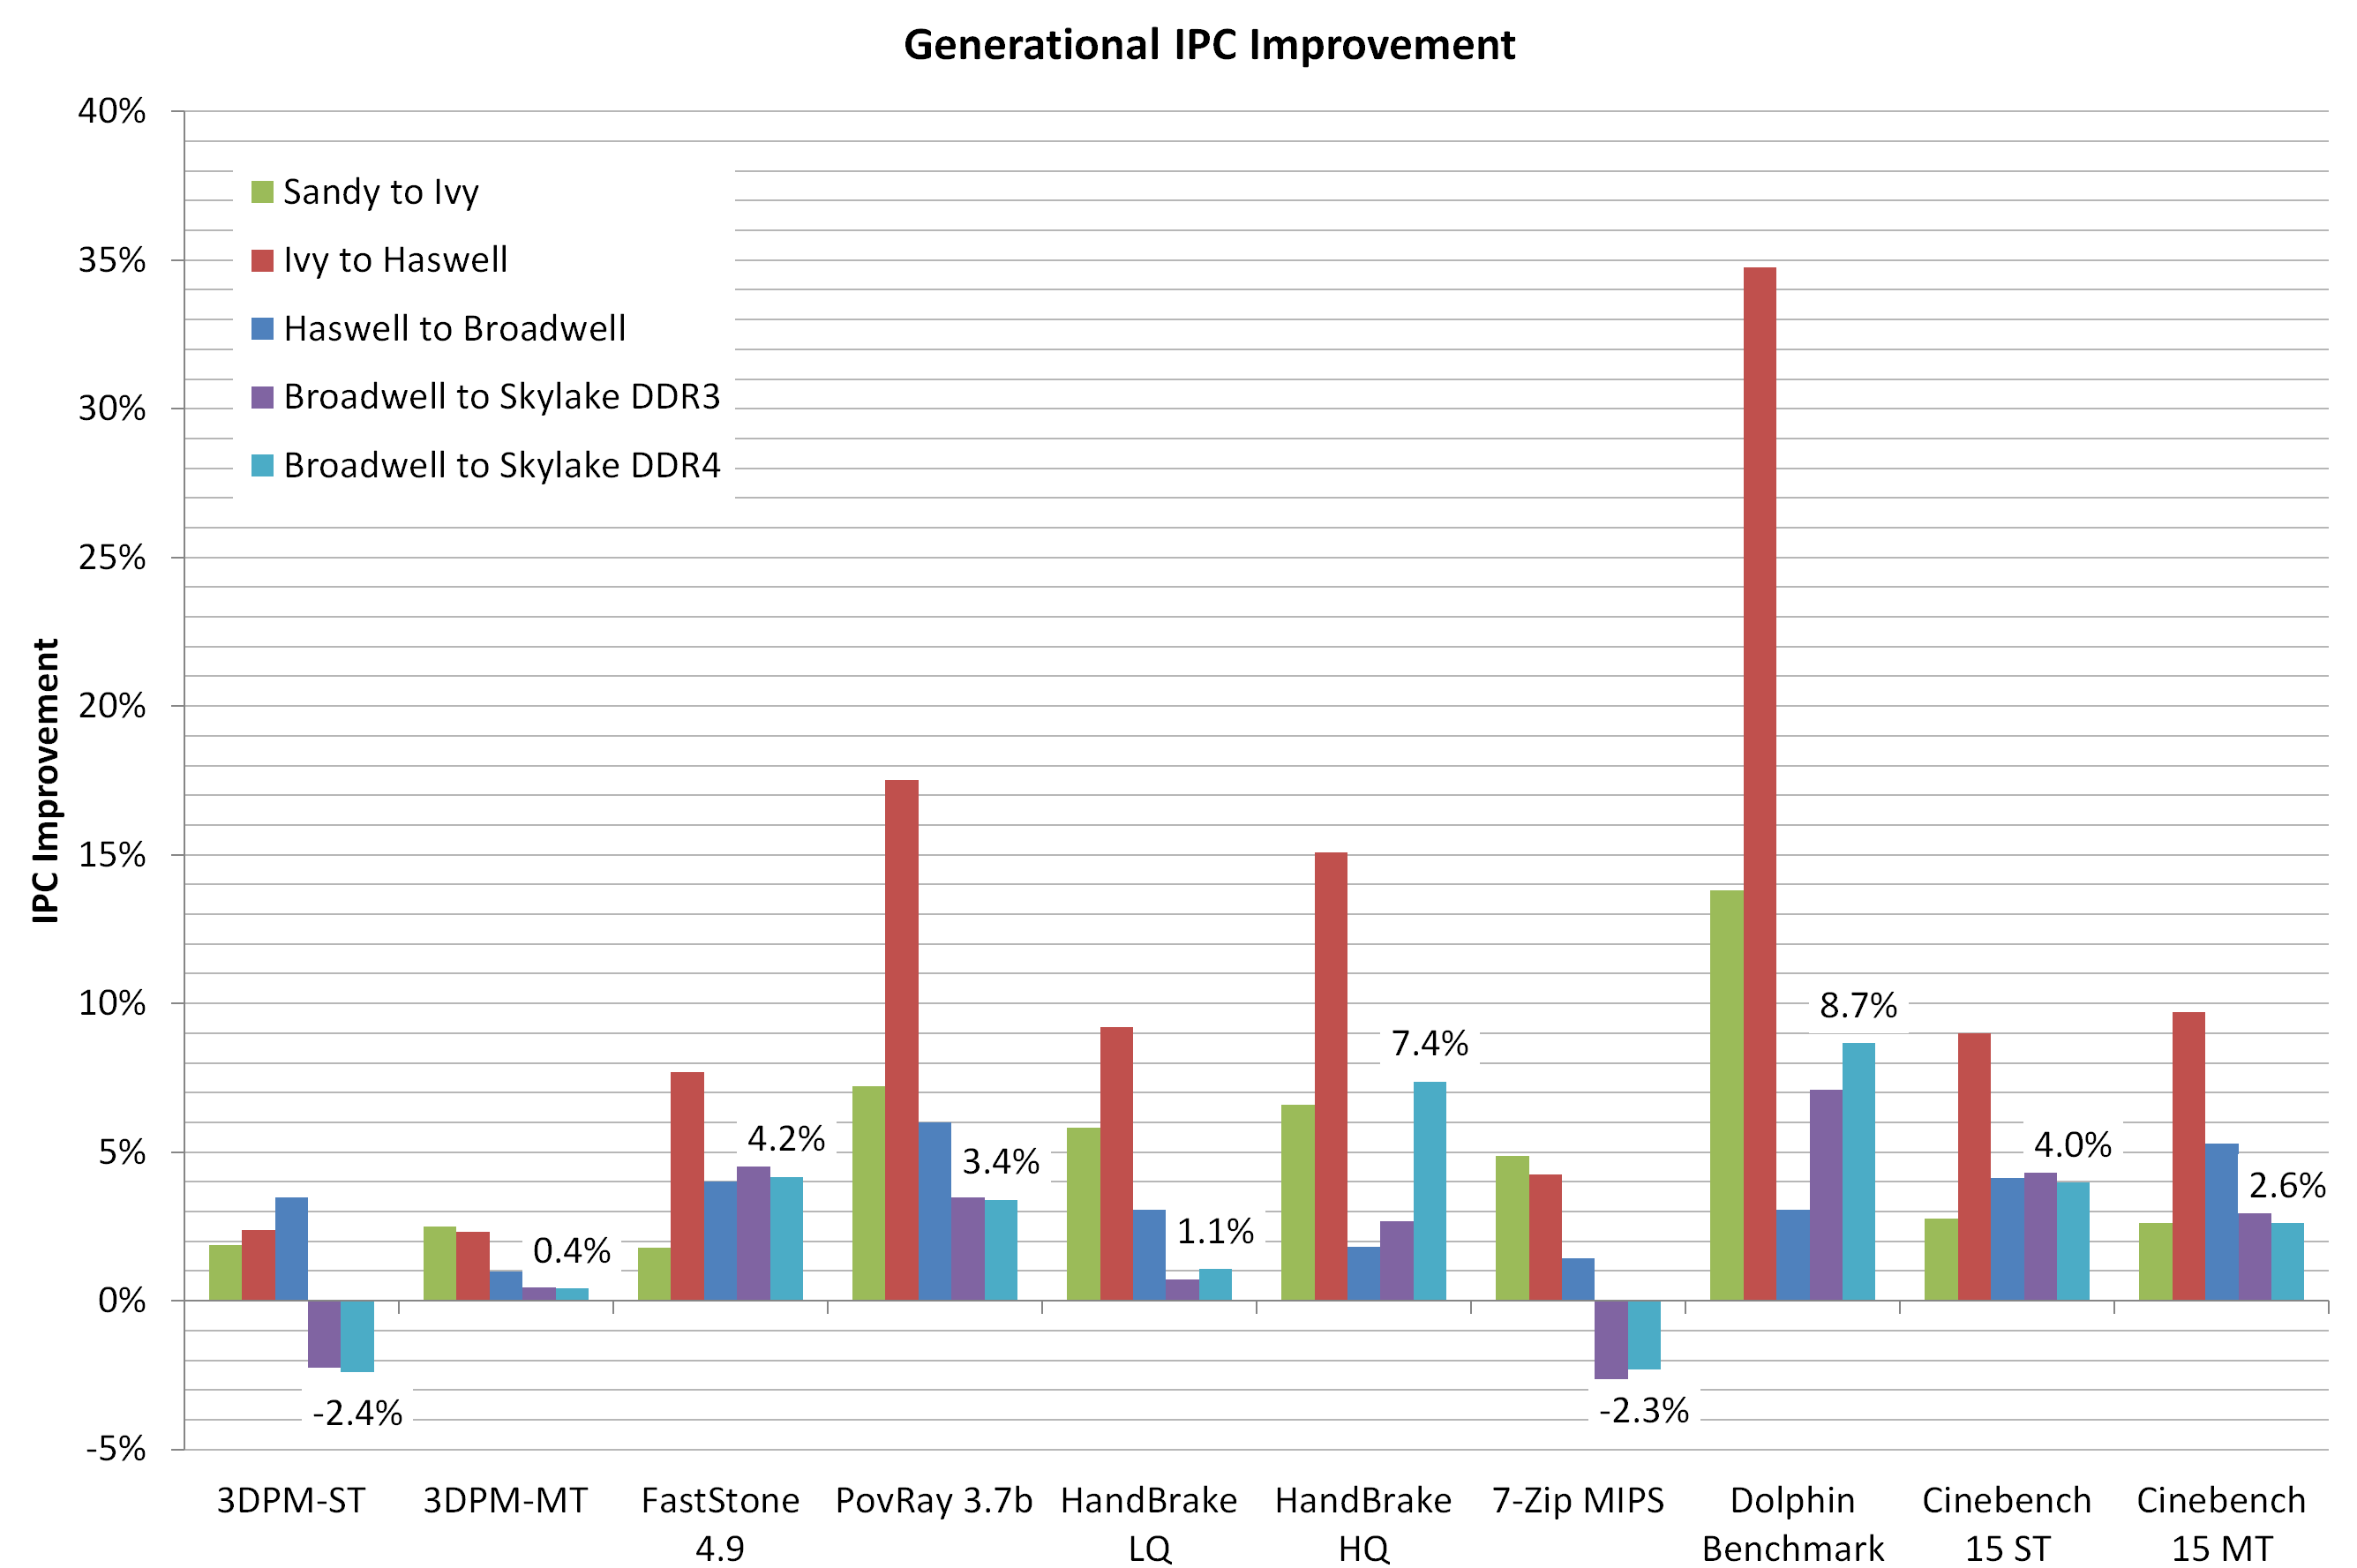
This graph shows that:
Sandy Bridge to Ivy Bridge: Average ~5.8% Up
Ivy Bridge to Haswell: Average ~11.2% Up
Haswell to Broadwell: Average ~3.3% Up
Broadwell to Skylake (DDR3): Average ~2.4% Up
Broadwell to Skylake (DDR4): Average ~2.7% Up
Oh dear. Typically with an architecture update we see a bigger increase in performance than 2.7% IPC. Looking at matters purely from this perspective, Skylake does not come out well. These results suggest that Skylake is merely another minor upgrade in the performance metrics, and that a clock for clock result compared to Broadwell is not favorable. However, consider that very few people actually invested in Broadwell. If anything, Haswell was the last major mainstream processor generation that people actually purchased, which means that:
Haswell to Skylake (DDR3): Average ~5.7% Up.
This is more of a bearable increase, and it takes advantage of the fact that Broadwell on the desktop was a niche focused launch. The other results in the review will be interesting to see.
Comparing IPC on Skylake: Discrete Gaming
For this set of tests, we kept things simple – a low end single R7 240 DDR3, an ex-high end GTX 770 Lightning and a top line GTX 980 on our standard CPU game set under normal conditions. The IGP is not used here on the basis that each generation uses a substantially different integrated graphics arrangement.
Alien: Isolation
If first person survival mixed with horror is your sort of thing, then Alien: Isolation, based off of the Alien franchise, should be an interesting title. Developed by The Creative Assembly and released in October 2014, Alien: Isolation has won numerous awards from Game Of The Year to several top 10s/25s and Best Horror titles, ratcheting up over a million sales by February 2015. Alien: Isolation uses a custom built engine which includes dynamic sound effects and should be fully multi-core enabled.
For low end graphics, we test at 720p with Ultra settings, whereas for mid and high range graphics we bump this up to 1080p, taking the average frame rate as our marker with a scripted version of the built-in benchmark.
Total War: Attila
The Total War franchise moves on to Attila, another The Creative Assembly development, and is a stand-alone strategy title set in 395AD where the main story line lets the gamer take control of the leader of the Huns in order to conquer parts of the world. Graphically the game can render hundreds/thousands of units on screen at once, all with their individual actions and can put some of the big cards to task.
For low end graphics, we test at 720p with performance settings, recording the average frame rate. With mid and high range graphics, we test at 1080p with the quality setting. In both circumstances, unlimited video memory is enabled and the in-game scripted benchmark is used.
Grand Theft Auto V
The highly anticipated iteration of the Grand Theft Auto franchise finally hit the shelves on April 14th 2015, with both AMD and NVIDIA in tow to help optimize the title. GTA doesn’t provide graphical presets, but opens up the options to users and extends the boundaries by pushing even the hardest systems to the limit using Rockstar’s Advanced Game Engine. Whether the user is flying high in the mountains with long draw distances or dealing with assorted trash in the city, when cranked up to maximum it creates stunning visuals but hard work for both the CPU and the GPU.
For our test we have scripted a version of the in-game benchmark, relying only on the final part which combines a flight scene along with an in-city drive-by followed by a tanker explosion. For low end systems we test at 720p on the lowest settings, whereas mid and high end graphics play at 1080p with very high settings across the board. We record both the average frame rate and the percentage of frames under 60 FPS (16.6ms).

GRID: Autosport
No graphics tests are complete without some input from Codemasters and the EGO engine, which means for this round of testing we point towards GRID: Autosport, the next iteration in the GRID and racing genre. As with our previous racing testing, each update to the engine aims to add in effects, reflections, detail and realism, with Codemasters making ‘authenticity’ a main focal point for this version.
GRID’s benchmark mode is very flexible, and as a result we created a test race using a shortened version of the Red Bull Ring with twelve cars doing two laps. The car is focus starts last and is quite fast, but usually finishes second or third. For low end graphics we test at 1080p medium settings, whereas mid and high end graphics get the full 1080p maximum. Both the average and minimum frame rates are recorded.
Middle-Earth: Shadow of Mordor
The final title in our testing is another battle of system performance with the open world action-adventure title, Shadow of Mordor. Produced by Monolith using the LithTech Jupiter EX engine and numerous detail add-ons, SoM goes for detail and complexity to a large extent, despite having to be cut down from the original plans. The main story itself was written by the same writer as Red Dead Redemption, and it received Zero Punctuation’s Game of The Year in 2014.
For testing purposes, SoM gives a dynamic screen resolution setting, allowing us to render at high resolutions that are then scaled down to the monitor. As a result, we get several tests using the in-game benchmark. For low end graphics we examine at 720p with low settings, whereas mid and high end graphics get 1080p Ultra. The top graphics test is also redone at 3840x2160, also with Ultra settings, and we also test two cards at 4K where possible.
Conclusions on Gaming
There’s no easy way to write this.
Discrete graphics card performance decreases on Skylake over Haswell.
This doesn’t particularly make much sense at first glance. Here we have a processor with a higher IPC than Haswell but it performs worse in both DDR3 and DDR4 modes. The amount by which it performs worse is actually relatively minor, usually -3% with the odd benchmark (GRID on R7 240) going as low as -5%. Why does this happen at all?
So we passed our results on to Intel, as well as a few respected colleagues in the industry, all of whom were quite surprised. During a benchmark, the CPU performs tasks and directs memory transfers through the PCIe bus and vice versa. Technically, the CPU tasks should complete quicker due to the IPC and the improved threading topology, so that only leaves the PCIe to DRAM via CPU transfers.
Our best guess, until we get to IDF to analyze what has been changed or a direct explanation from Intel, is that part of the FIFO buffer arrangement between the CPU and PCIe might have changed with a hint of additional latency. That being said, a minor increase in PCIe overhead (or a decrease in latency/bandwidth) should be masked by the workload, so there might be something more fundamental at play, such as bus requests being accidentally duplicated or resent due to signal breakdown. There might also be a tertiary answer of an internal bus not running at full speed. To be sure, we rested some benchmarks on a different i7-6700K and a different motherboard, but saw the same effect. We’ll see how this plays out on the full-speed tests.
Generational Tests on the i7-6700K: Legacy, Office and Web Benchmarks
Moving on to the generational tests, and similar to our last Broadwell review I want to dedicate a few pages to specifically looking at how stock speed processors perform as Intel has released each generation. For this each CPU is left at stock, DRAM set to DDR3-1600 (or DDR4-2133 for Skylake in DDR4 mode) and we run the full line of CPU tests at our disposal.
Legacy
Some users will notice that in our benchmark database Bench, we keep data on the CPUs we’ve tested back over a decade and the benchmarks we were running back then. For a few of these benchmarks, such as Cinebench R10, we do actually run these on the new CPUs as well, although for the sake of brevity and relevance we tend not to put this data in the review. Well here are a few of those numbers too.
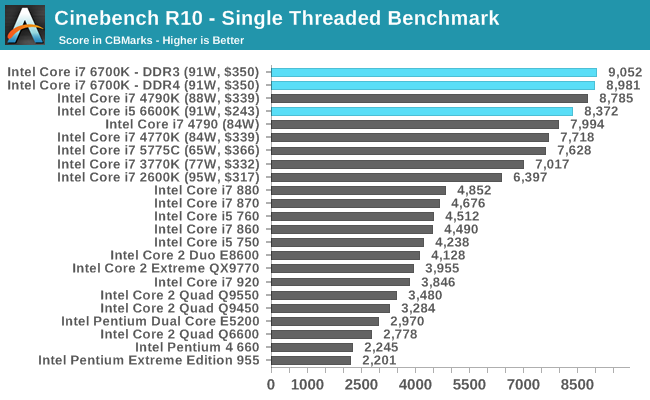
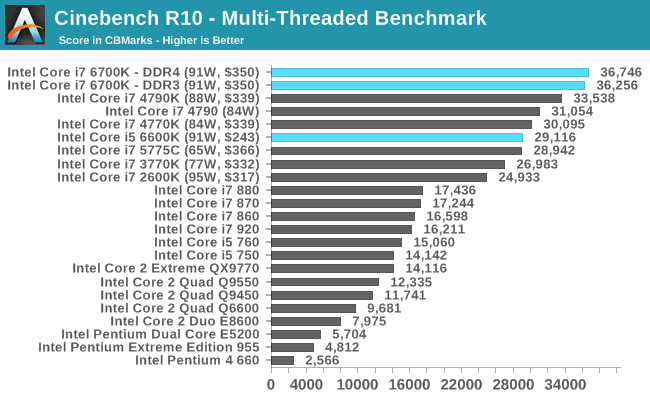
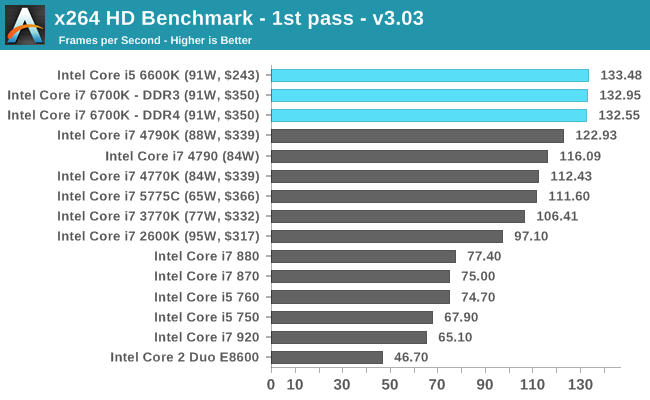
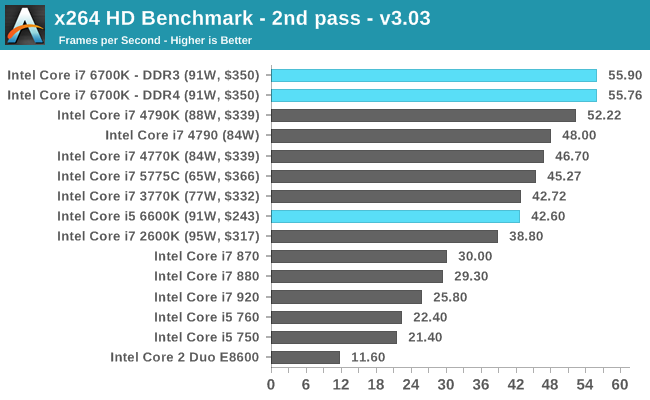
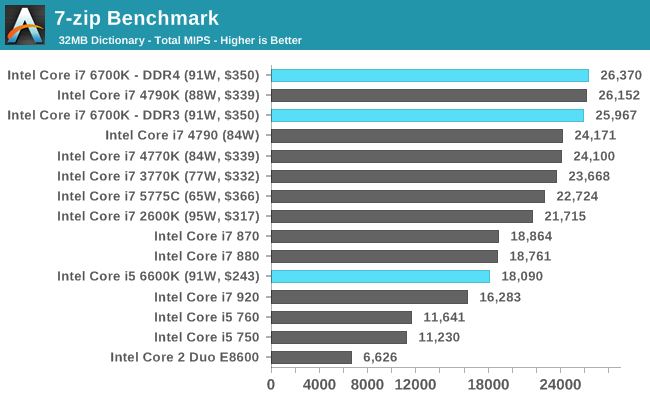
Even with the older tests that might not include any new instruction sets, the Skylake CPUs sit on top of the stack.
Office Performance
The dynamics of CPU Turbo modes, both Intel and AMD, can cause concern during environments with a variable threaded workload. There is also an added issue of the motherboard remaining consistent, depending on how the motherboard manufacturer wants to add in their own boosting technologies over the ones that Intel would prefer they used. In order to remain consistent, we implement an OS-level unique high performance mode on all the CPUs we test which should override any motherboard manufacturer performance mode.
Dolphin Benchmark: link
Many emulators are often bound by single thread CPU performance, and general reports tended to suggest that Haswell provided a significant boost to emulator performance. This benchmark runs a Wii program that raytraces a complex 3D scene inside the Dolphin Wii emulator. Performance on this benchmark is a good proxy of the speed of Dolphin CPU emulation, which is an intensive single core task using most aspects of a CPU. Results are given in minutes, where the Wii itself scores 17.53 minutes.
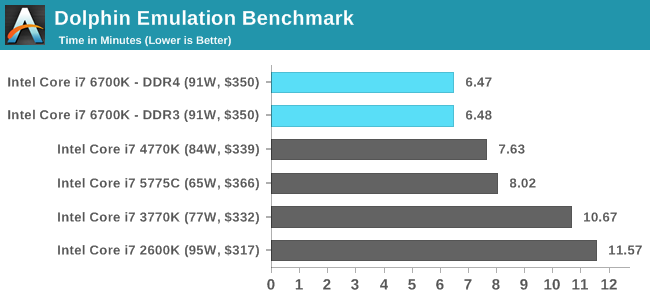
WinRAR 5.0.1: link
Our WinRAR test from 2013 is updated to the latest version of WinRAR at the start of 2014. We compress a set of 2867 files across 320 folders totalling 1.52 GB in size – 95% of these files are small typical website files, and the rest (90% of the size) are small 30 second 720p videos.
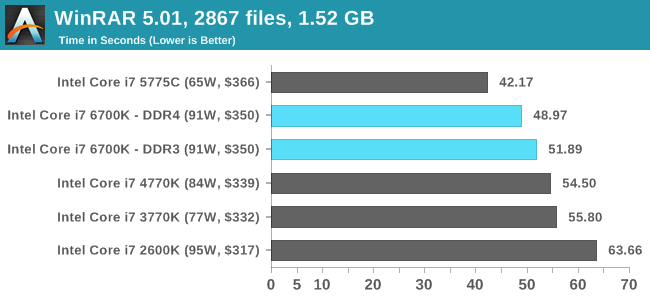
3D Particle Movement
3DPM is a self-penned benchmark, taking basic 3D movement algorithms used in Brownian Motion simulations and testing them for speed. High floating point performance, MHz and IPC wins in the single thread version, whereas the multithread version has to handle the threads and loves more cores.
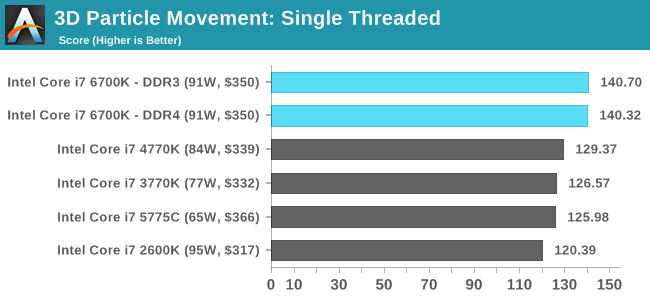
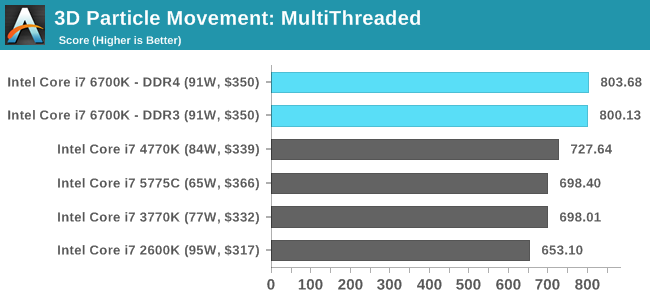
FastStone Image Viewer 4.9
FastStone is the program I use to perform quick or bulk actions on images, such as resizing, adjusting for color and cropping. In our test we take a series of 170 images in various sizes and formats and convert them all into 640x480 .gif files, maintaining the aspect ratio. FastStone does not use multithreading for this test, and results are given in seconds.
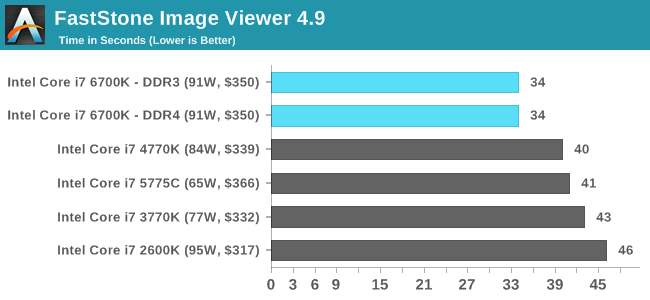
Web Benchmarks
On the lower end processors, general usability is a big factor of experience, especially as we move into the HTML5 era of web browsing. For our web benchmarks, we take four well known tests with Chrome 35 as a consistent browser.
Sunspider 1.0.2
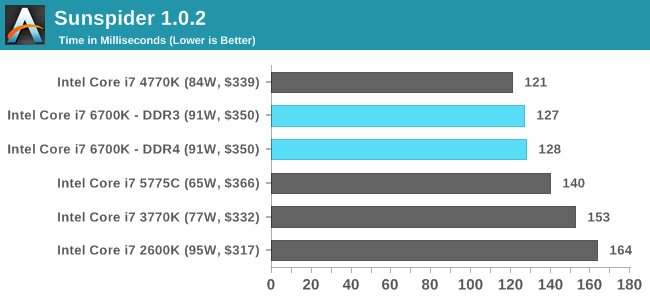
Mozilla Kraken 1.1
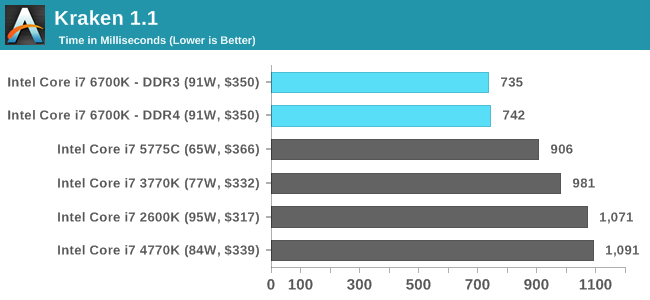
WebXPRT
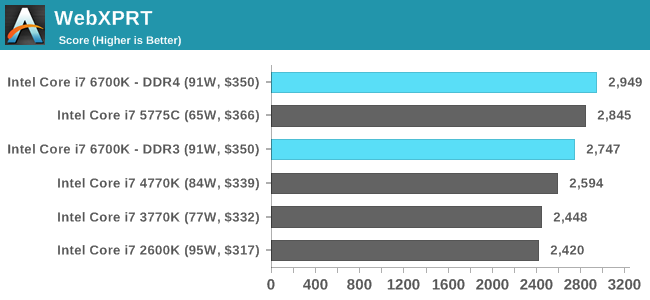
Google Octane v2
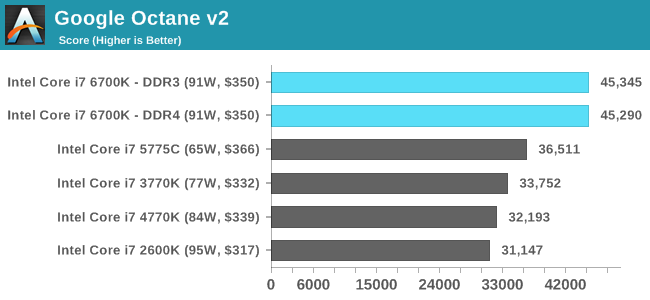
Generational Tests on the i7-6700K: Windows Professional Performance
Agisoft Photoscan – 2D to 3D Image Manipulation: link
Agisoft Photoscan creates 3D models from 2D images, a process which is very computationally expensive. The algorithm is split into four distinct phases, and different phases of the model reconstruction require either fast memory, fast IPC, more cores, or even OpenCL compute devices to hand. Agisoft supplied us with a special version of the software to script the process, where we take 50 images of a stately home and convert it into a medium quality model. This benchmark typically takes around 15-20 minutes on a high end PC on the CPU alone, with GPUs reducing the time.
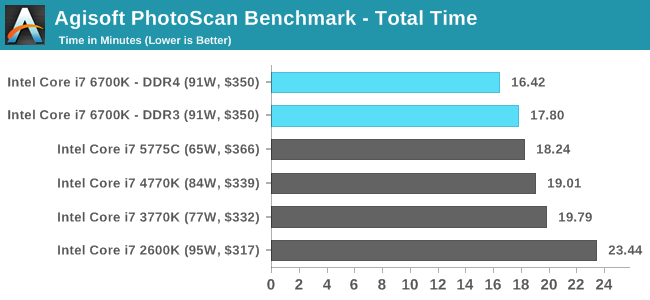
Cinebench R15
Cinebench is a benchmark based around Cinema 4D, and is fairly well known among enthusiasts for stressing the CPU for a provided workload. Results are given as a score, where higher is better.
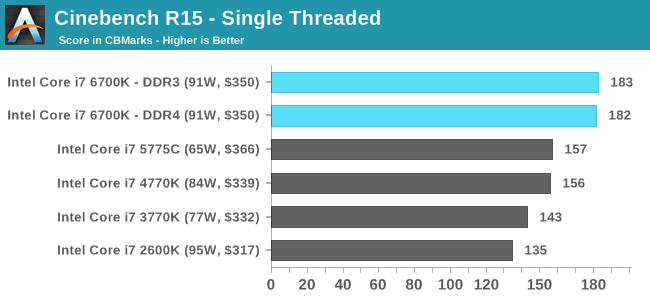
HandBrake v0.9.9: link
For HandBrake, we take two videos (a 2h20 640x266 DVD rip and a 10min double UHD 3840x4320 animation short) and convert them to x264 format in an MP4 container. Results are given in terms of the frames per second processed, and HandBrake uses as many threads as possible.
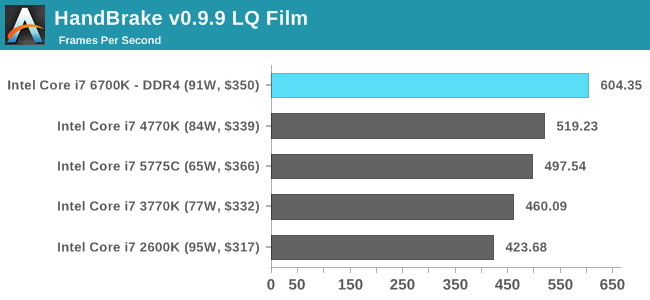
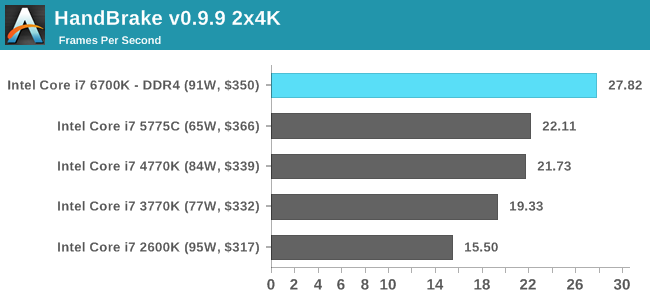
Hybrid x265
Hybrid is a new benchmark, where we take a 4K 1500 frame video and convert it into an x265 format without audio. Results are given in frames per second.
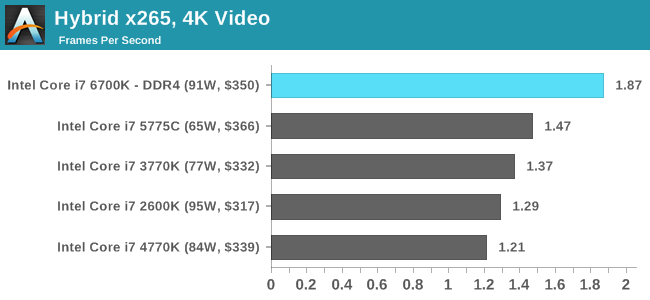
Generational Tests on the i7-6700K: Linux Performance
Built around several freely available benchmarks for Linux, Linux-Bench is a project spearheaded by Patrick at ServeTheHome to streamline about a dozen of these tests in a single neat package run via a set of three commands using an Ubuntu 11.04 LiveCD. These tests include fluid dynamics used by NASA, ray-tracing, OpenSSL, molecular modeling, and a scalable data structure server for web deployments. We run Linux-Bench and have chosen to report a select few of the tests that rely on CPU and DRAM speed.
C-Ray: link
C-Ray is a simple ray-tracing program that focuses almost exclusively on processor performance rather than DRAM access. The test in Linux-Bench renders a heavy complex scene offering a large scalable scenario.
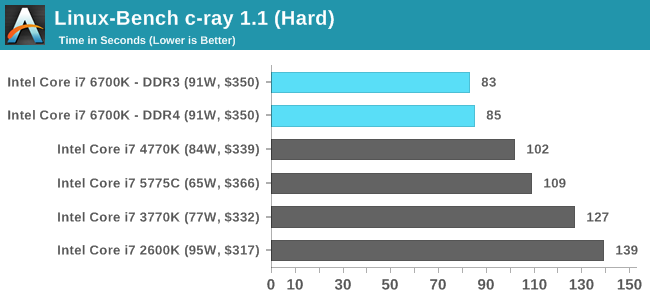
NAMD, Scalable Molecular Dynamics: link
Developed by the Theoretical and Computational Biophysics Group at the University of Illinois at Urbana-Champaign, NAMD is a set of parallel molecular dynamics codes for extreme parallelization up to and beyond 200,000 cores. The reference paper detailing NAMD has over 4000 citations, and our testing runs a small simulation where the calculation steps per unit time is the output vector.
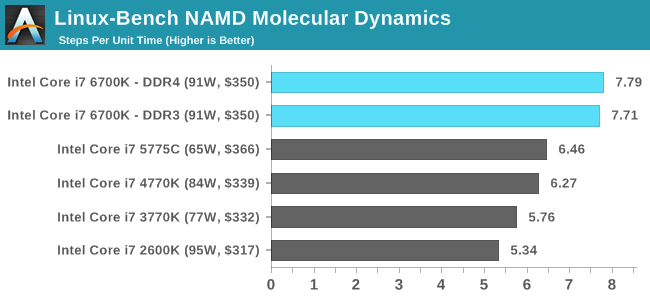
NPB, Fluid Dynamics: link
Aside from LINPACK, there are many other ways to benchmark supercomputers in terms of how effective they are for various types of mathematical processes. The NAS Parallel Benchmarks (NPB) are a set of small programs originally designed for NASA to test their supercomputers in terms of fluid dynamics simulations, useful for airflow reactions and design.
Redis: link
Many of the online applications rely on key-value caches and data structure servers to operate. Redis is an open-source, scalable web technology with a b developer base, but also relies heavily on memory bandwidth as well as CPU performance.
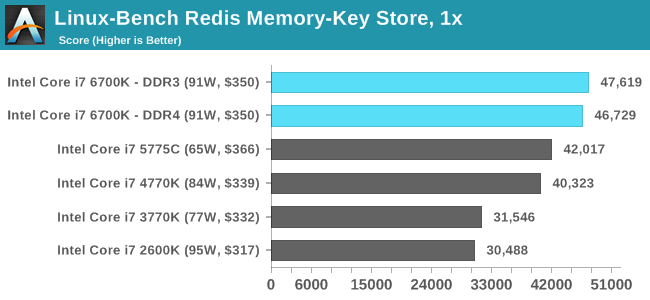
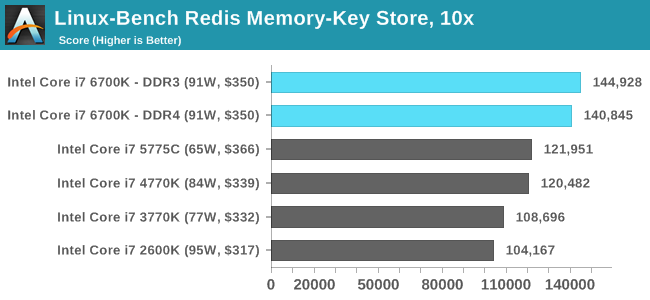
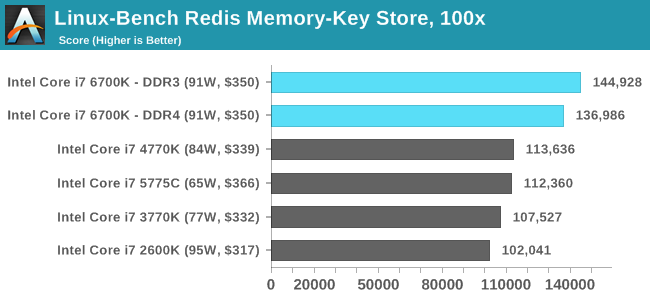
Generational Tests: Gaming Benchmarks on Low End
Alien: Isolation
If first person survival mixed with horror is your sort of thing, then Alien: Isolation, based off of the Alien franchise, should be an interesting title. Developed by The Creative Assembly and released in October 2014, Alien: Isolation has won numerous awards from Game Of The Year to several top 10s/25s and Best Horror titles, ratcheting up over a million sales by February 2015. Alien: Isolation uses a custom built engine which includes dynamic sound effects and should be fully multi-core enabled.
For low end graphics, we test at 720p with Ultra settings, whereas for mid and high range graphics we bump this up to 1080p, taking the average frame rate as our marker with a scripted version of the built-in benchmark.
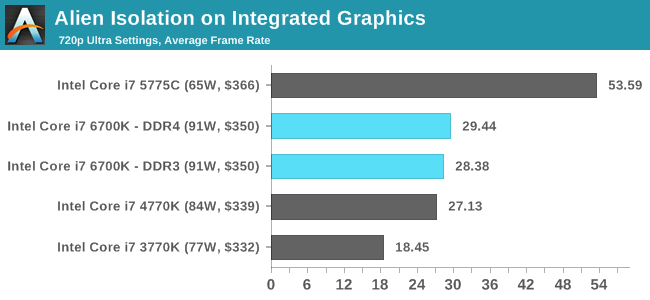

Total War: Attila
The Total War franchise moves on to Attila, another The Creative Assembly development, and is a stand-alone strategy title set in 395AD where the main story line lets the gamer take control of the leader of the Huns in order to conquer parts of the world. Graphically the game can render hundreds/thousands of units on screen at once, all with their individual actions and can put some of the big cards to task.
For low end graphics, we test at 720p with performance settings, recording the average frame rate. With mid and high range graphics, we test at 1080p with the quality setting. In both circumstances, unlimited video memory is enabled and the in-game scripted benchmark is used.
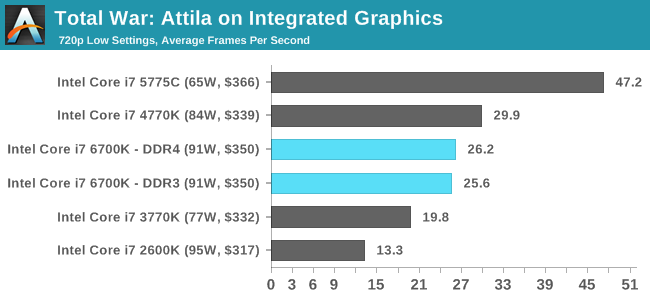
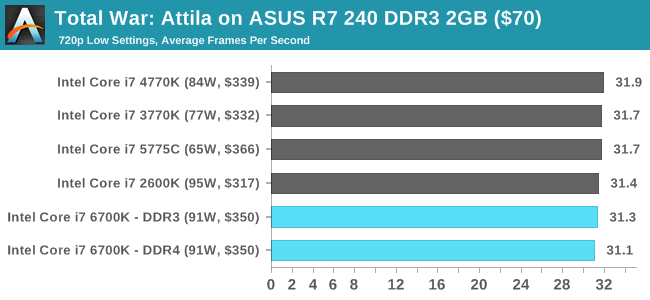
Grand Theft Auto V
The highly anticipated iteration of the Grand Theft Auto franchise finally hit the shelves on April 14th 2015, with both AMD and NVIDIA in tow to help optimize the title. GTA doesn’t provide graphical presets, but opens up the options to users and extends the boundaries by pushing even the hardest systems to the limit using Rockstar’s Advanced Game Engine. Whether the user is flying high in the mountains with long draw distances or dealing with assorted trash in the city, when cranked up to maximum it creates stunning visuals but hard work for both the CPU and the GPU.
For our test we have scripted a version of the in-game benchmark, relying only on the final part which combines a flight scene along with an in-city drive-by followed by a tanker explosion. For low end systems we test at 720p on the lowest settings, whereas mid and high end graphics play at 1080p with very high settings across the board. We record both the average frame rate and the percentage of frames under 60 FPS (16.6ms).
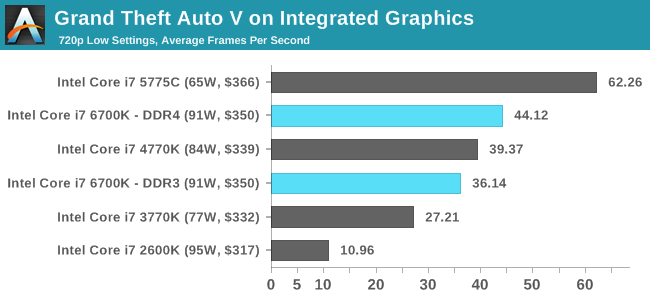
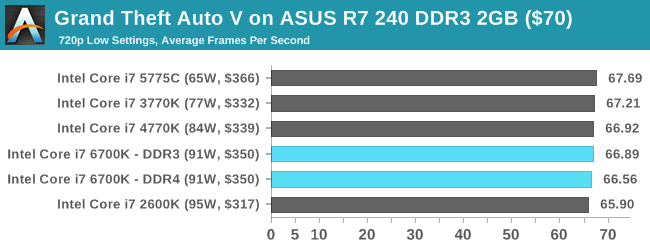
GRID: Autosport
No graphics tests are complete without some input from Codemasters and the EGO engine, which means for this round of testing we point towards GRID: Autosport, the next iteration in the GRID and racing genre. As with our previous racing testing, each update to the engine aims to add in effects, reflections, detail and realism, with Codemasters making ‘authenticity’ a main focal point for this version.
GRID’s benchmark mode is very flexible, and as a result we created a test race using a shortened version of the Red Bull Ring with twelve cars doing two laps. The car is focus starts last and is quite fast, but usually finishes second or third. For low end graphics we test at 1080p medium settings, whereas mid and high end graphics get the full 1080p maximum. Both the average and minimum frame rates are recorded.
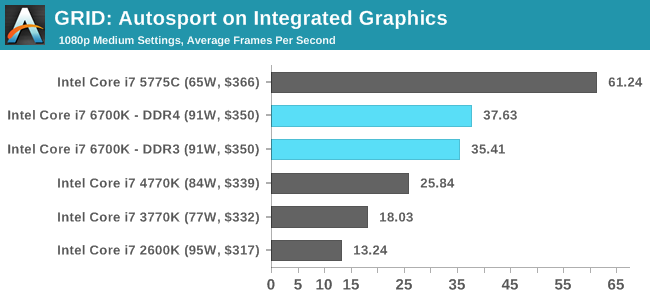
Middle-Earth: Shadow of Mordor
The final title in our testing is another battle of system performance with the open world action-adventure title, Shadow of Mordor. Produced by Monolith using the LithTech Jupiter EX engine and numerous detail add-ons, SoM goes for detail and complexity to a large extent, despite having to be cut down from the original plans. The main story itself was written by the same writer as Red Dead Redemption, and it received Zero Punctuation’s Game of The Year in 2014.
For testing purposes, SoM gives a dynamic screen resolution setting, allowing us to render at high resolutions that are then scaled down to the monitor. As a result, we get several tests using the in-game benchmark. For low end graphics we examine at 720p with low settings, whereas mid and high end graphics get 1080p Ultra. The top graphics test is also redone at 3840x2160, also with Ultra settings, and we also test two cards at 4K where possible.
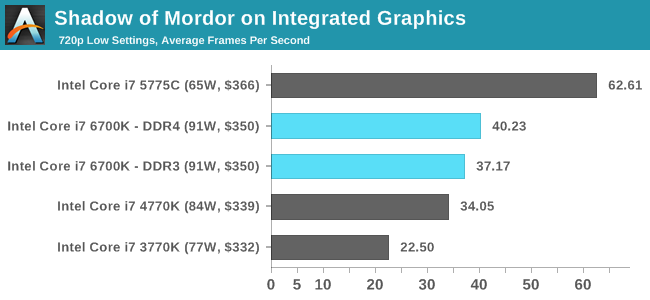

Generational Tests on the i7-6700K: Gaming Benchmarks on Mid-Range GPUs
Alien: Isolation
If first person survival mixed with horror is your sort of thing, then Alien: Isolation, based off of the Alien franchise, should be an interesting title. Developed by The Creative Assembly and released in October 2014, Alien: Isolation has won numerous awards from Game Of The Year to several top 10s/25s and Best Horror titles, ratcheting up over a million sales by February 2015. Alien: Isolation uses a custom built engine which includes dynamic sound effects and should be fully multi-core enabled.
For low end graphics, we test at 720p with Ultra settings, whereas for mid and high range graphics we bump this up to 1080p, taking the average frame rate as our marker with a scripted version of the built-in benchmark.
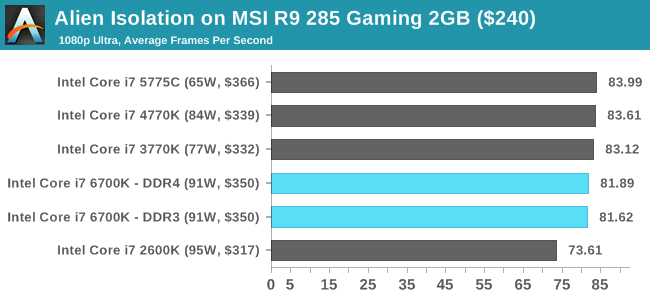
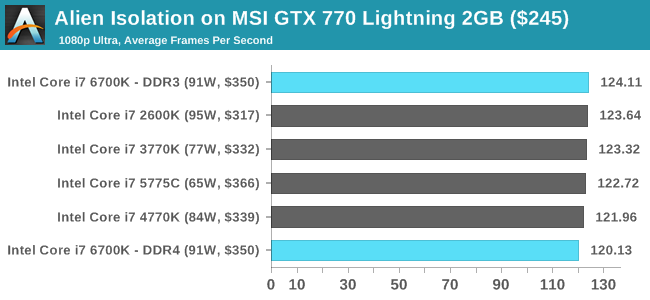
Total War: Attila
The Total War franchise moves on to Attila, another The Creative Assembly development, and is a stand-alone strategy title set in 395AD where the main story line lets the gamer take control of the leader of the Huns in order to conquer parts of the world. Graphically the game can render hundreds/thousands of units on screen at once, all with their individual actions and can put some of the big cards to task.
For low end graphics, we test at 720p with performance settings, recording the average frame rate. With mid and high range graphics, we test at 1080p with the quality setting. In both circumstances, unlimited video memory is enabled and the in-game scripted benchmark is used.
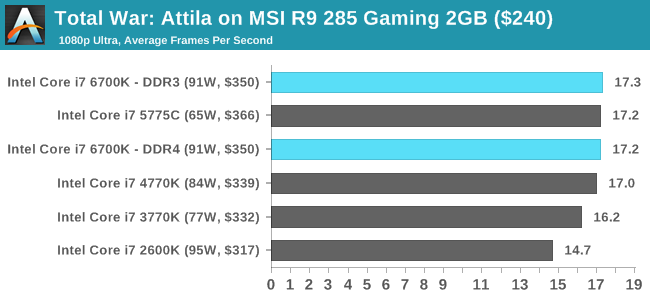
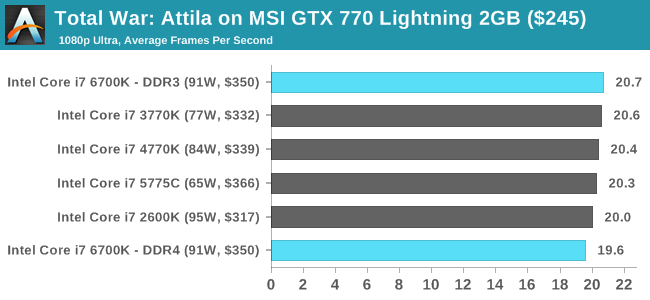
Grand Theft Auto V
The highly anticipated iteration of the Grand Theft Auto franchise finally hit the shelves on April 14th 2015, with both AMD and NVIDIA in tow to help optimize the title. GTA doesn’t provide graphical presets, but opens up the options to users and extends the boundaries by pushing even the hardest systems to the limit using Rockstar’s Advanced Game Engine. Whether the user is flying high in the mountains with long draw distances or dealing with assorted trash in the city, when cranked up to maximum it creates stunning visuals but hard work for both the CPU and the GPU.
For our test we have scripted a version of the in-game benchmark, relying only on the final part which combines a flight scene along with an in-city drive-by followed by a tanker explosion. For low end systems we test at 720p on the lowest settings, whereas mid and high end graphics play at 1080p with very high settings across the board. We record both the average frame rate and the percentage of frames under 60 FPS (16.6ms).
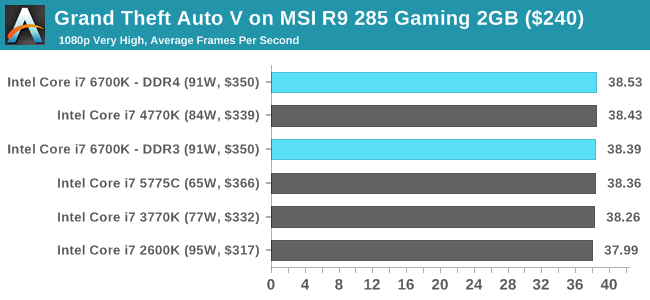
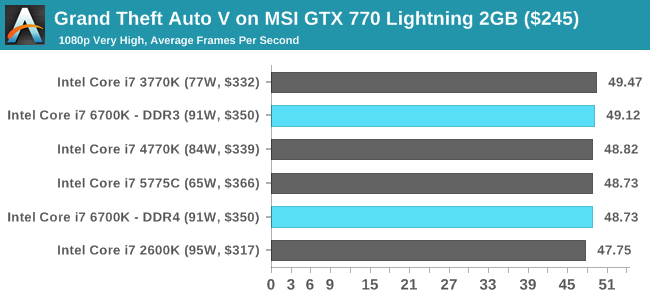
GRID: Autosport
No graphics tests are complete without some input from Codemasters and the EGO engine, which means for this round of testing we point towards GRID: Autosport, the next iteration in the GRID and racing genre. As with our previous racing testing, each update to the engine aims to add in effects, reflections, detail and realism, with Codemasters making ‘authenticity’ a main focal point for this version.
GRID’s benchmark mode is very flexible, and as a result we created a test race using a shortened version of the Red Bull Ring with twelve cars doing two laps. The car is focus starts last and is quite fast, but usually finishes second or third. For low end graphics we test at 1080p medium settings, whereas mid and high end graphics get the full 1080p maximum. Both the average and minimum frame rates are recorded.
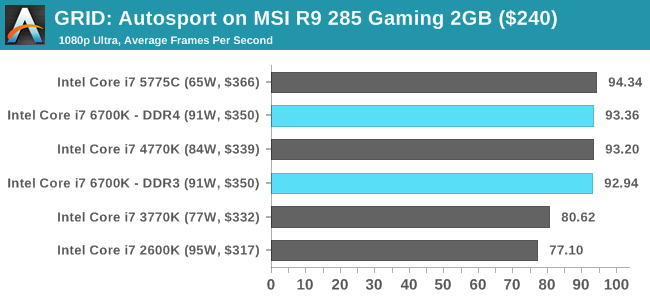
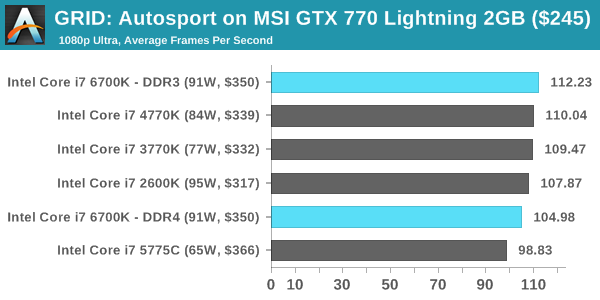
Middle-Earth: Shadow of Mordor
The final title in our testing is another battle of system performance with the open world action-adventure title, Shadow of Mordor. Produced by Monolith using the LithTech Jupiter EX engine and numerous detail add-ons, SoM goes for detail and complexity to a large extent, despite having to be cut down from the original plans. The main story itself was written by the same writer as Red Dead Redemption, and it received Zero Punctuation’s Game of The Year in 2014.
For testing purposes, SoM gives a dynamic screen resolution setting, allowing us to render at high resolutions that are then scaled down to the monitor. As a result, we get several tests using the in-game benchmark. For low end graphics we examine at 720p with low settings, whereas mid and high end graphics get 1080p Ultra. The top graphics test is also redone at 3840x2160, also with Ultra settings, and we also test two cards at 4K where possible.
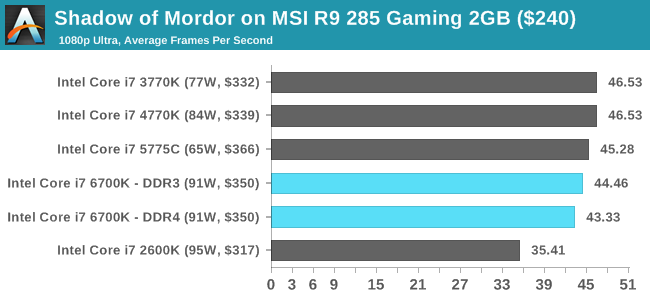
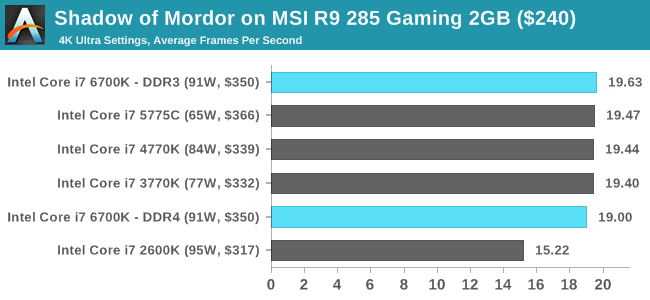
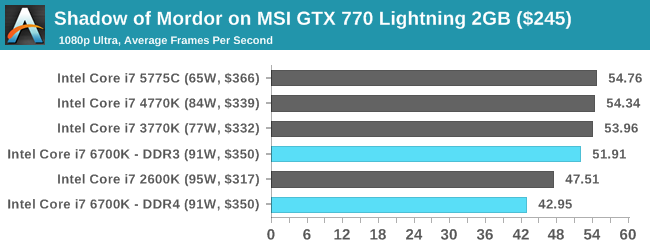
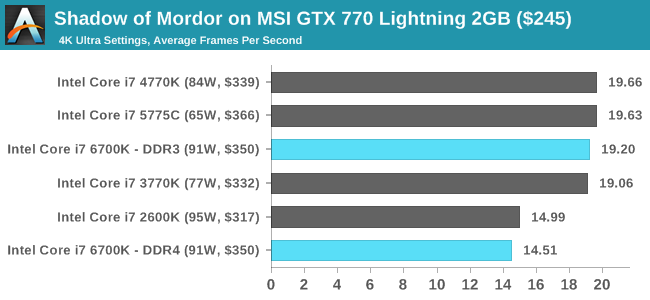
Generational Tests on the i7-6700K: Gaming Benchmarks on High End GPUs
Alien: Isolation
If first person survival mixed with horror is your sort of thing, then Alien: Isolation, based off of the Alien franchise, should be an interesting title. Developed by The Creative Assembly and released in October 2014, Alien: Isolation has won numerous awards from Game Of The Year to several top 10s/25s and Best Horror titles, ratcheting up over a million sales by February 2015. Alien: Isolation uses a custom built engine which includes dynamic sound effects and should be fully multi-core enabled.
For low end graphics, we test at 720p with Ultra settings, whereas for mid and high range graphics we bump this up to 1080p, taking the average frame rate as our marker with a scripted version of the built-in benchmark.
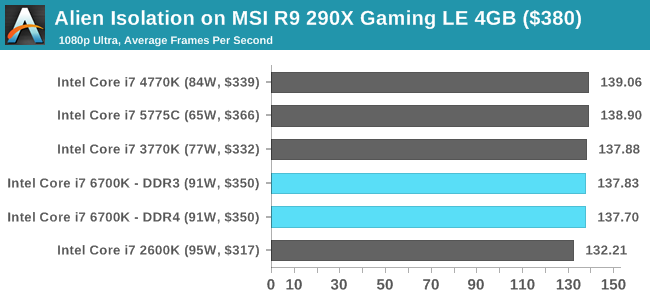
Total War: Attila
The Total War franchise moves on to Attila, another The Creative Assembly development, and is a stand-alone strategy title set in 395AD where the main story line lets the gamer take control of the leader of the Huns in order to conquer parts of the world. Graphically the game can render hundreds/thousands of units on screen at once, all with their individual actions and can put some of the big cards to task.
For low end graphics, we test at 720p with performance settings, recording the average frame rate. With mid and high range graphics, we test at 1080p with the quality setting. In both circumstances, unlimited video memory is enabled and the in-game scripted benchmark is used.
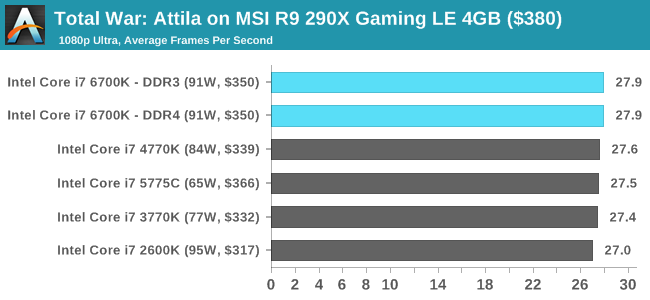
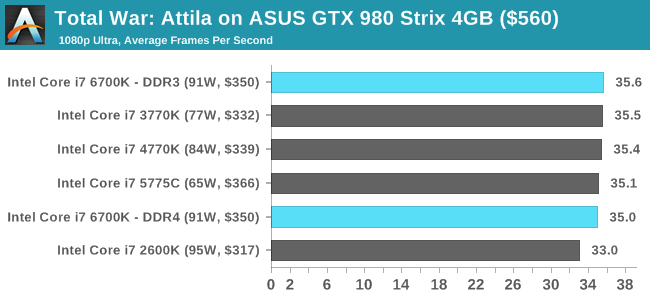
Grand Theft Auto V
The highly anticipated iteration of the Grand Theft Auto franchise finally hit the shelves on April 14th 2015, with both AMD and NVIDIA in tow to help optimize the title. GTA doesn’t provide graphical presets, but opens up the options to users and extends the boundaries by pushing even the hardest systems to the limit using Rockstar’s Advanced Game Engine. Whether the user is flying high in the mountains with long draw distances or dealing with assorted trash in the city, when cranked up to maximum it creates stunning visuals but hard work for both the CPU and the GPU.
For our test we have scripted a version of the in-game benchmark, relying only on the final part which combines a flight scene along with an in-city drive-by followed by a tanker explosion. For low end systems we test at 720p on the lowest settings, whereas mid and high end graphics play at 1080p with very high settings across the board. We record both the average frame rate and the percentage of frames under 60 FPS (16.6ms).
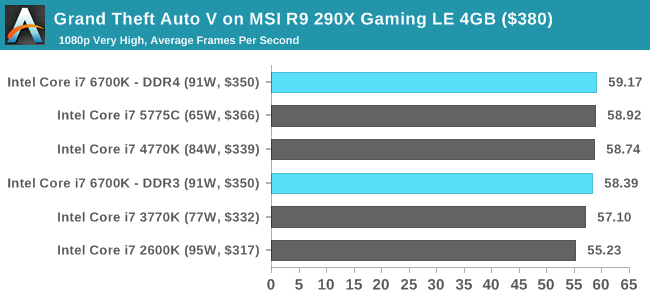
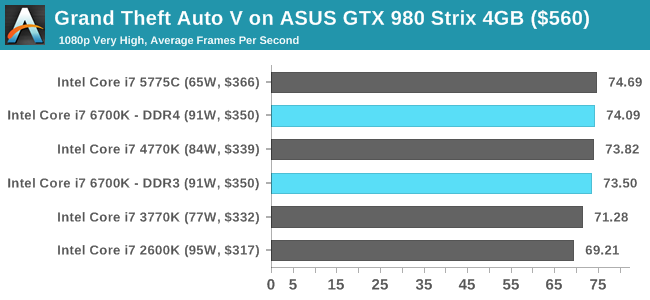
GRID: Autosport
No graphics tests are complete without some input from Codemasters and the EGO engine, which means for this round of testing we point towards GRID: Autosport, the next iteration in the GRID and racing genre. As with our previous racing testing, each update to the engine aims to add in effects, reflections, detail and realism, with Codemasters making ‘authenticity’ a main focal point for this version.
GRID’s benchmark mode is very flexible, and as a result we created a test race using a shortened version of the Red Bull Ring with twelve cars doing two laps. The car is focus starts last and is quite fast, but usually finishes second or third. For low end graphics we test at 1080p medium settings, whereas mid and high end graphics get the full 1080p maximum. Both the average and minimum frame rates are recorded.
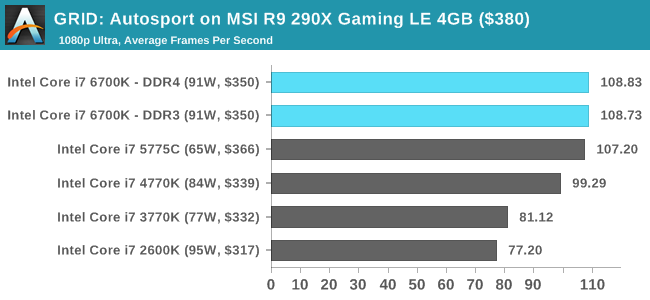

Middle-Earth: Shadow of Mordor
The final title in our testing is another battle of system performance with the open world action-adventure title, Shadow of Mordor. Produced by Monolith using the LithTech Jupiter EX engine and numerous detail add-ons, SoM goes for detail and complexity to a large extent, despite having to be cut down from the original plans. The main story itself was written by the same writer as Red Dead Redemption, and it received Zero Punctuation’s Game of The Year in 2014.
For testing purposes, SoM gives a dynamic screen resolution setting, allowing us to render at high resolutions that are then scaled down to the monitor. As a result, we get several tests using the in-game benchmark. For low end graphics we examine at 720p with low settings, whereas mid and high end graphics get 1080p Ultra. The top graphics test is also redone at 3840x2160, also with Ultra settings, and we also test two cards at 4K where possible.

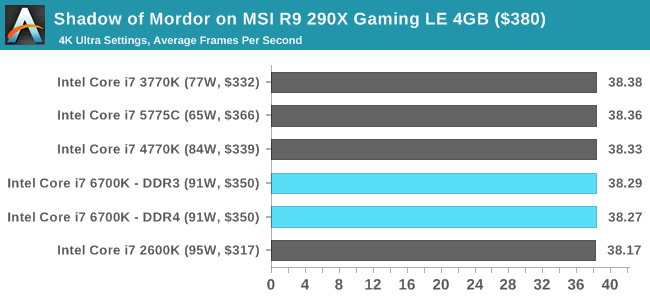
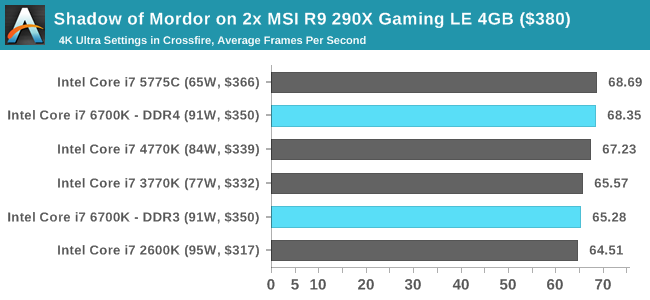
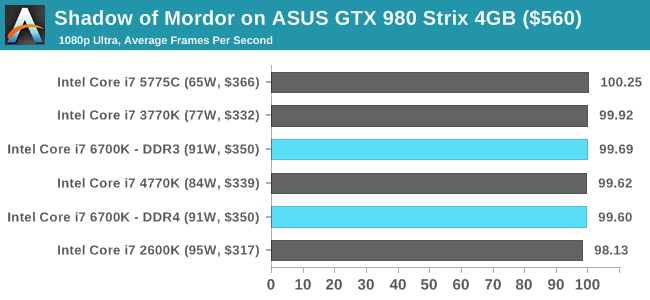
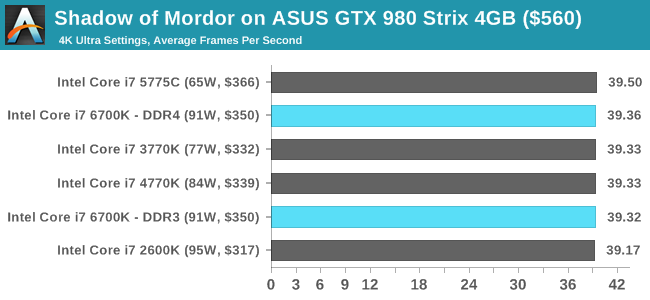
What You Can Buy: Office and Web Benchmarks
For the last segment of graphs, we have the same data as the previous few generational pages but we have also included other processors from our database for non-standard comparisons.
All of our benchmark results can also be found in our benchmark engine, Bench.
Office Performance
Dolphin Benchmark: link
Many emulators are often bound by single thread CPU performance, and general reports tended to suggest that Haswell provided a significant boost to emulator performance. This benchmark runs a Wii program that raytraces a complex 3D scene inside the Dolphin Wii emulator. Performance on this benchmark is a good proxy of the speed of Dolphin CPU emulation, which is an intensive single core task using most aspects of a CPU. Results are given in minutes, where the Wii itself scores 17.53 minutes.
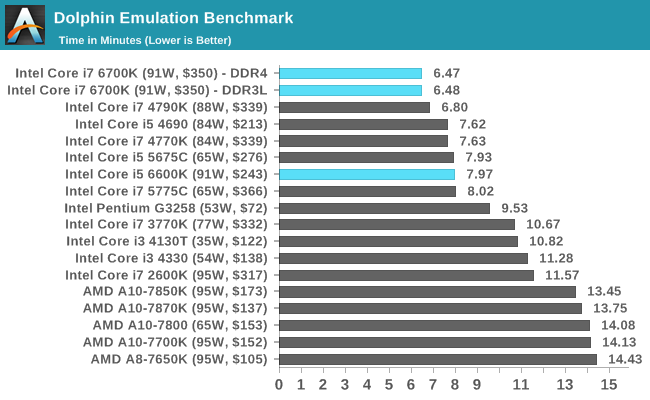
WinRAR 5.0.1: link
Our WinRAR test from 2013 is updated to the latest version of WinRAR at the start of 2014. We compress a set of 2867 files across 320 folders totaling 1.52 GB in size – 95% of these files are small typical website files, and the rest (90% of the size) are small 30 second 720p videos.
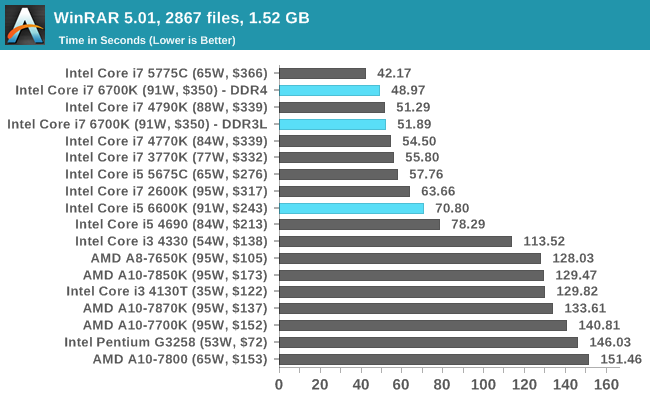
3D Particle Movement
3DPM is a self-penned benchmark, taking basic 3D movement algorithms used in Brownian Motion simulations and testing them for speed. High floating point performance, MHz and IPC wins in the single thread version, whereas the multithread version has to handle the threads and loves more cores.
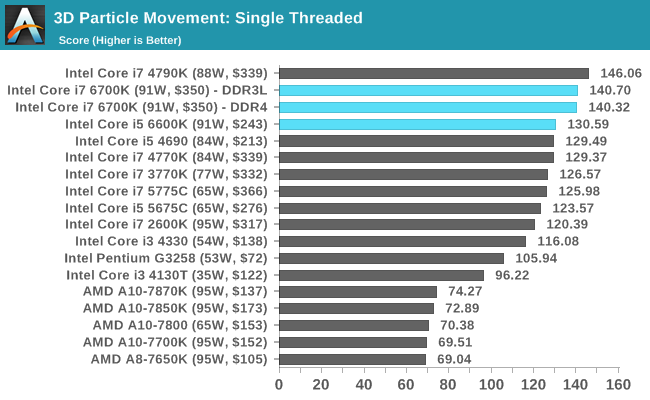
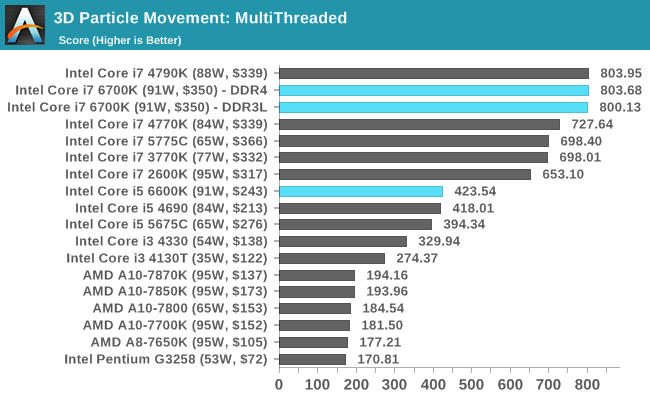
FastStone Image Viewer 4.9
FastStone is the program I use to perform quick or bulk actions on images, such as resizing, adjusting for color and cropping. In our test we take a series of 170 images in various sizes and formats and convert them all into 640x480 .gif files, maintaining the aspect ratio. FastStone does not use multithreading for this test, and results are given in seconds.
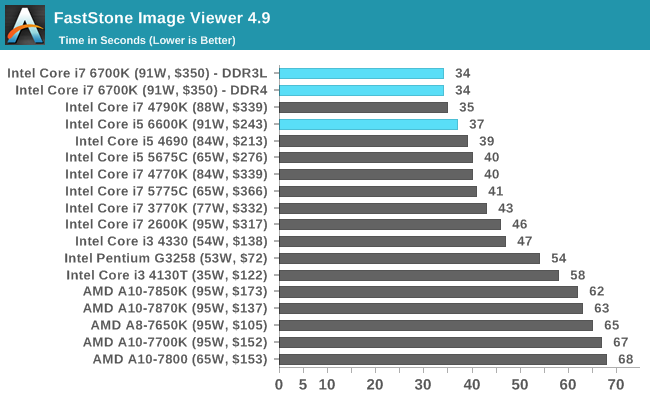
Web Benchmarks
On the lower end processors, general usability is a big factor of experience, especially as we move into the HTML5 era of web browsing. For our web benchmarks, we take four well known tests with Chrome 35 as a consistent browser.
Sunspider 1.0.2
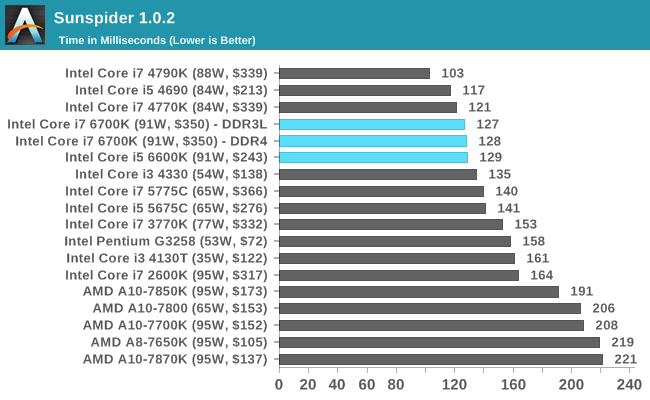
Mozilla Kraken 1.1
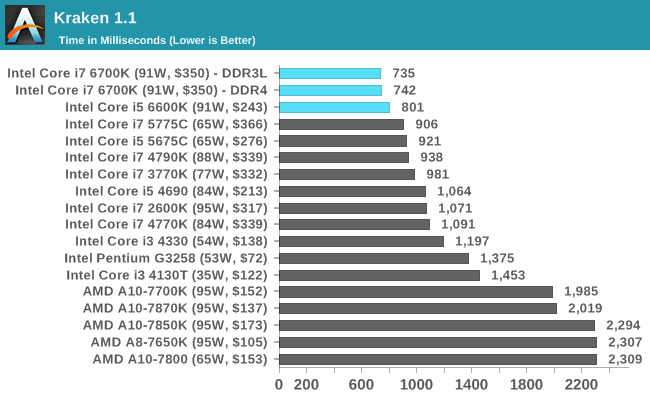
WebXPRT
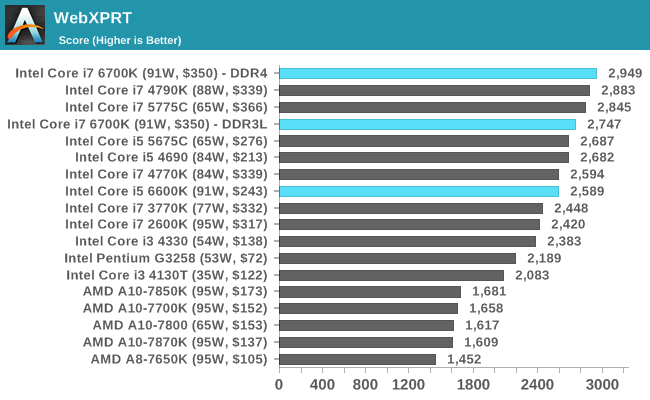
Google Octane v2
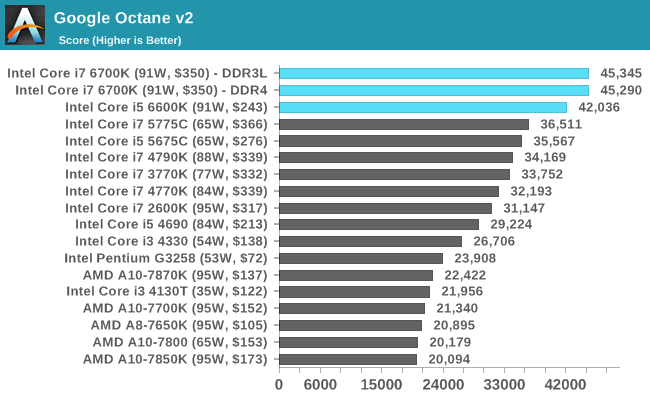
What You Can Buy: Windows Professional Performance
Agisoft Photoscan – 2D to 3D Image Manipulation: link
Agisoft Photoscan creates 3D models from 2D images, a process which is very computationally expensive. The algorithm is split into four distinct phases, and different phases of the model reconstruction require either fast memory, fast IPC, more cores, or even OpenCL compute devices to hand. Agisoft supplied us with a special version of the software to script the process, where we take 50 images of a stately home and convert it into a medium quality model. This benchmark typically takes around 15-20 minutes on a high end PC on the CPU alone, with GPUs reducing the time.
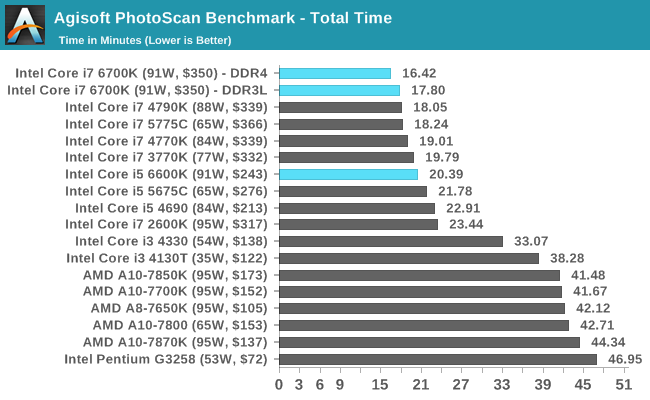
Cinebench R15
Cinebench is a benchmark based around Cinema 4D, and is fairly well known among enthusiasts for stressing the CPU for a provided workload. Results are given as a score, where higher is better.
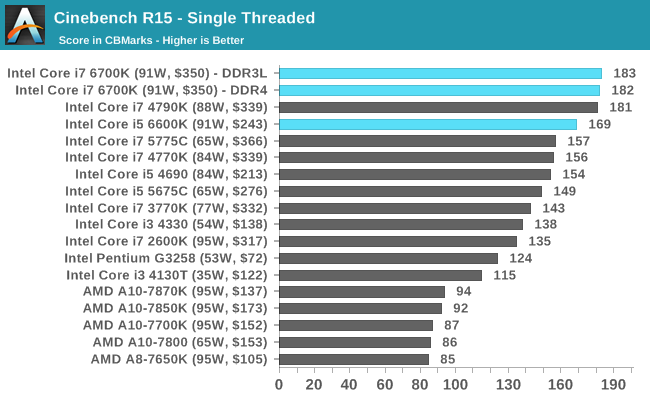
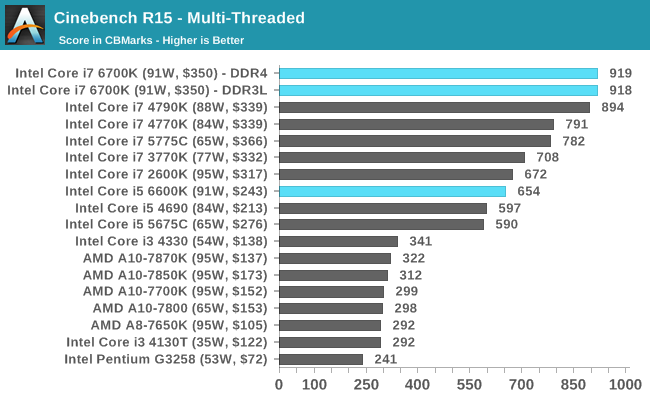
HandBrake v0.9.9: link
For HandBrake, we take two videos (a 2h20 640x266 DVD rip and a 10min double UHD 3840x4320 animation short) and convert them to x264 format in an MP4 container. Results are given in terms of the frames per second processed, and HandBrake uses as many threads as possible.
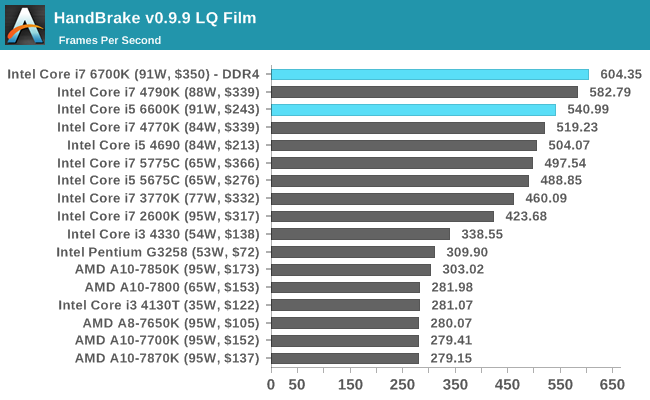
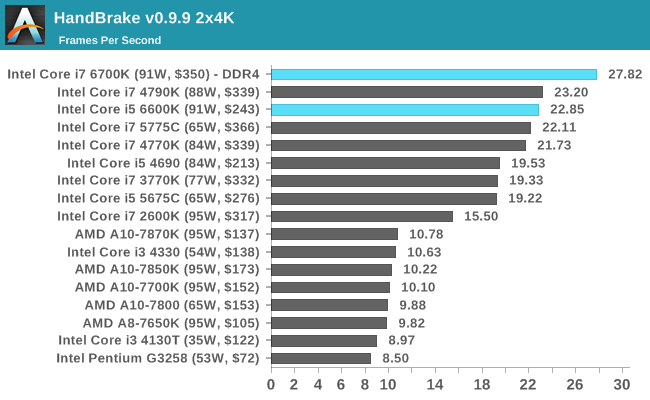
Hybrid x265
Hybrid is a new benchmark, where we take a 4K 1500 frame video and convert it into an x265 format without audio. Results are given in frames per second.
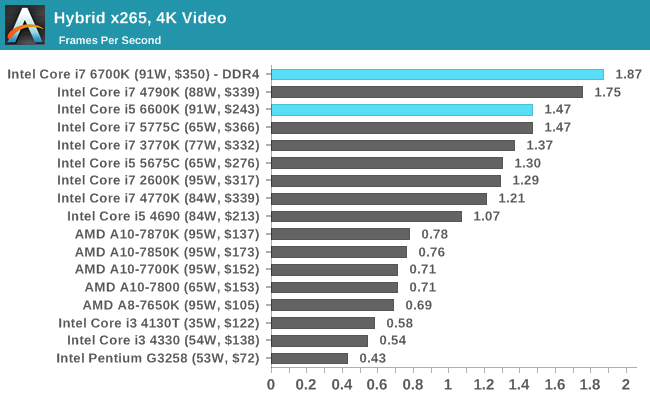
What You Can Buy: Linux Performance
Built around several freely available benchmarks for Linux, Linux-Bench is a project spearheaded by Patrick at ServeTheHome to streamline about a dozen of these tests in a single neat package run via a set of three commands using an Ubuntu 11.04 LiveCD. These tests include fluid dynamics used by NASA, ray-tracing, OpenSSL, molecular modeling, and a scalable data structure server for web deployments. We run Linux-Bench and have chosen to report a select few of the tests that rely on CPU and DRAM speed.
C-Ray: link
C-Ray is a simple ray-tracing program that focuses almost exclusively on processor performance rather than DRAM access. The test in Linux-Bench renders a heavy complex scene offering a large scalable scenario.
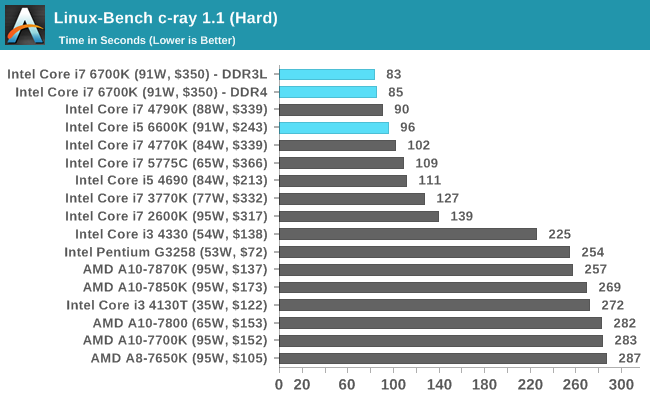
NAMD, Scalable Molecular Dynamics: link
Developed by the Theoretical and Computational Biophysics Group at the University of Illinois at Urbana-Champaign, NAMD is a set of parallel molecular dynamics codes for extreme parallelization up to and beyond 200,000 cores. The reference paper detailing NAMD has over 4000 citations, and our testing runs a small simulation where the calculation steps per unit time is the output vector.
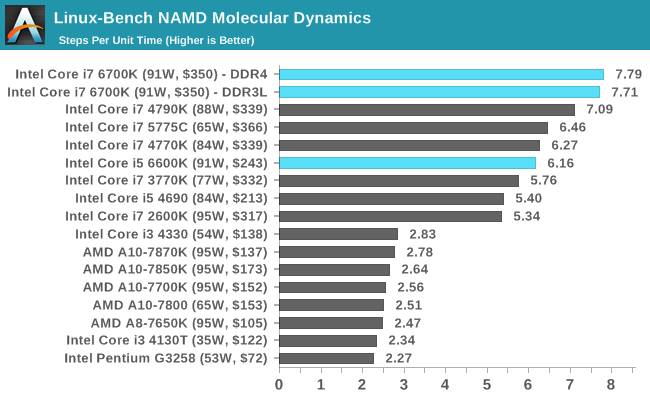
NPB, Fluid Dynamics: link
Aside from LINPACK, there are many other ways to benchmark supercomputers in terms of how effective they are for various types of mathematical processes. The NAS Parallel Benchmarks (NPB) are a set of small programs originally designed for NASA to test their supercomputers in terms of fluid dynamics simulations, useful for airflow reactions and design.
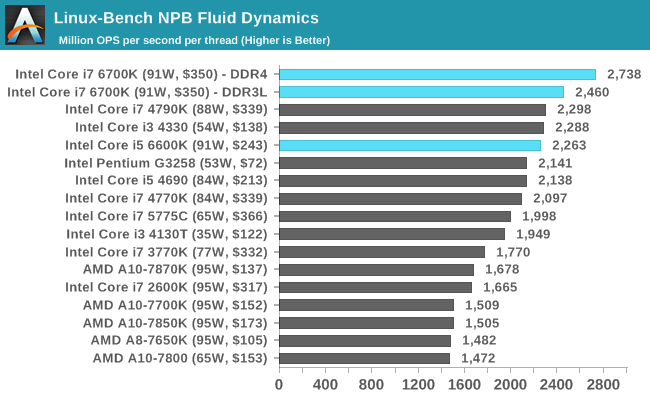
Redis: link
Many of the online applications rely on key-value caches and data structure servers to operate. Redis is an open-source, scalable web technology with a b developer base, but also relies heavily on memory bandwidth as well as CPU performance.
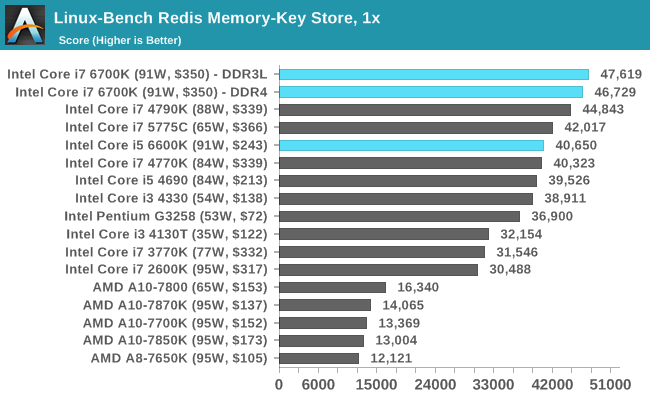
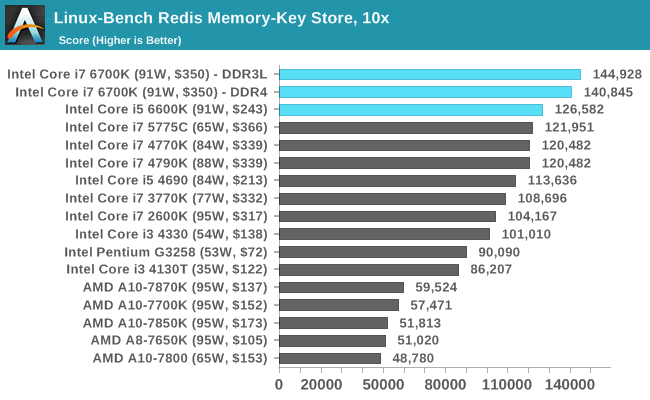
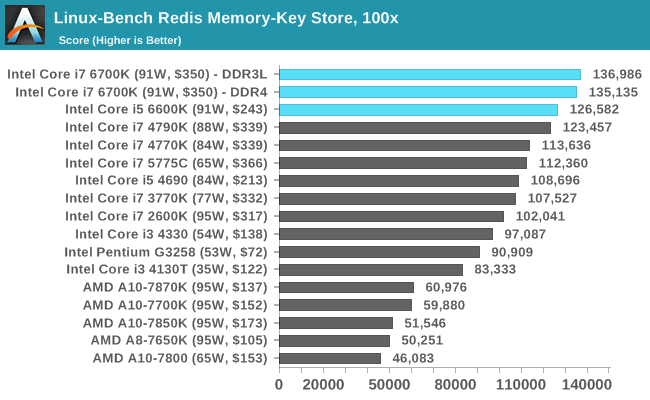
What You Can Buy: Gaming Benchmarks on Low End
Alien: Isolation
If first person survival mixed with horror is your sort of thing, then Alien: Isolation, based off of the Alien franchise, should be an interesting title. Developed by The Creative Assembly and released in October 2014, Alien: Isolation has won numerous awards from Game Of The Year to several top 10s/25s and Best Horror titles, ratcheting up over a million sales by February 2015. Alien: Isolation uses a custom built engine which includes dynamic sound effects and should be fully multi-core enabled.
For low end graphics, we test at 720p with Ultra settings, whereas for mid and high range graphics we bump this up to 1080p, taking the average frame rate as our marker with a scripted version of the built-in benchmark.
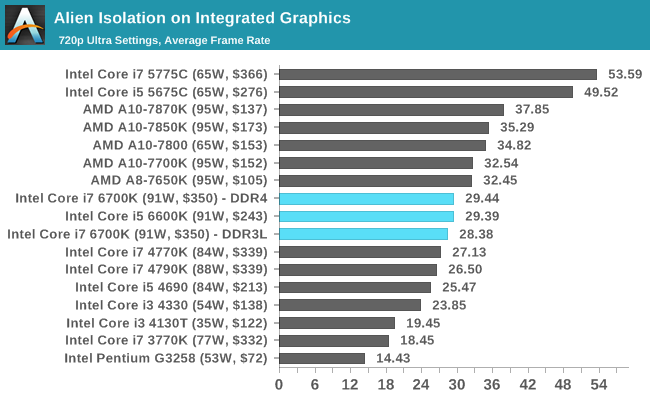
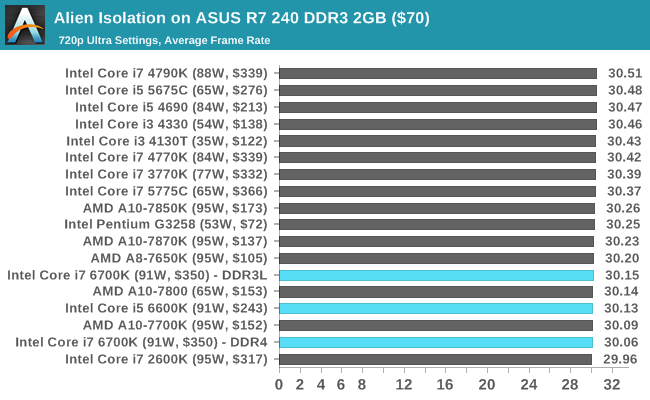
Total War: Attila
The Total War franchise moves on to Attila, another The Creative Assembly development, and is a stand-alone strategy title set in 395AD where the main story line lets the gamer take control of the leader of the Huns in order to conquer parts of the world. Graphically the game can render hundreds/thousands of units on screen at once, all with their individual actions and can put some of the big cards to task.
For low end graphics, we test at 720p with performance settings, recording the average frame rate. With mid and high range graphics, we test at 1080p with the quality setting. In both circumstances, unlimited video memory is enabled and the in-game scripted benchmark is used.
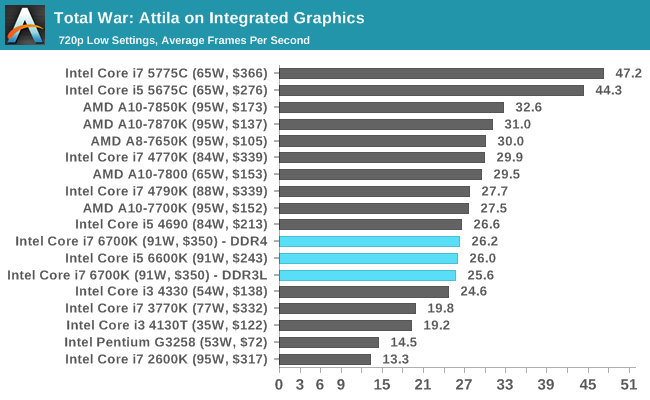
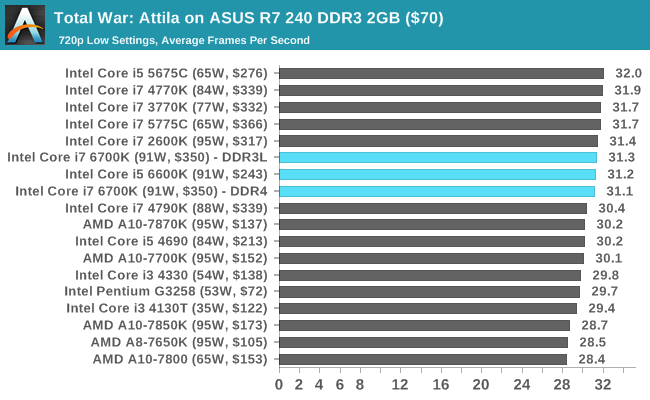
Grand Theft Auto V
The highly anticipated iteration of the Grand Theft Auto franchise finally hit the shelves on April 14th 2015, with both AMD and NVIDIA in tow to help optimize the title. GTA doesn’t provide graphical presets, but opens up the options to users and extends the boundaries by pushing even the hardest systems to the limit using Rockstar’s Advanced Game Engine. Whether the user is flying high in the mountains with long draw distances or dealing with assorted trash in the city, when cranked up to maximum it creates stunning visuals but hard work for both the CPU and the GPU.
For our test we have scripted a version of the in-game benchmark, relying only on the final part which combines a flight scene along with an in-city drive-by followed by a tanker explosion. For low end systems we test at 720p on the lowest settings, whereas mid and high end graphics play at 1080p with very high settings across the board. We record both the average frame rate and the percentage of frames under 60 FPS (16.6ms).
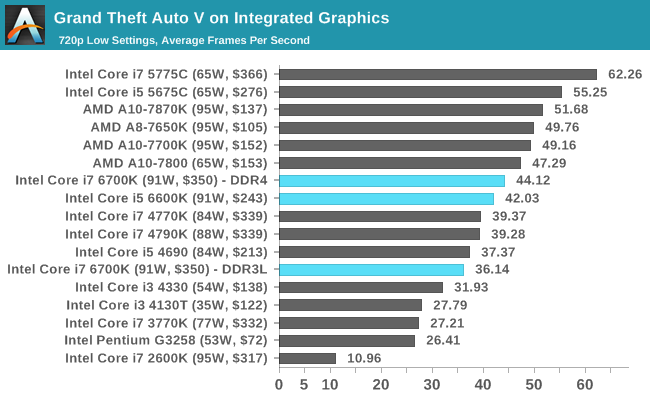
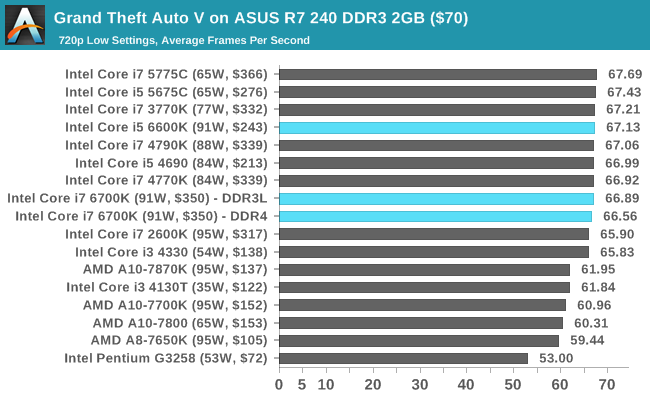
GRID: Autosport
No graphics tests are complete without some input from Codemasters and the EGO engine, which means for this round of testing we point towards GRID: Autosport, the next iteration in the GRID and racing genre. As with our previous racing testing, each update to the engine aims to add in effects, reflections, detail and realism, with Codemasters making ‘authenticity’ a main focal point for this version.
GRID’s benchmark mode is very flexible, and as a result we created a test race using a shortened version of the Red Bull Ring with twelve cars doing two laps. The car is focus starts last and is quite fast, but usually finishes second or third. For low end graphics we test at 1080p medium settings, whereas mid and high end graphics get the full 1080p maximum. Both the average and minimum frame rates are recorded.
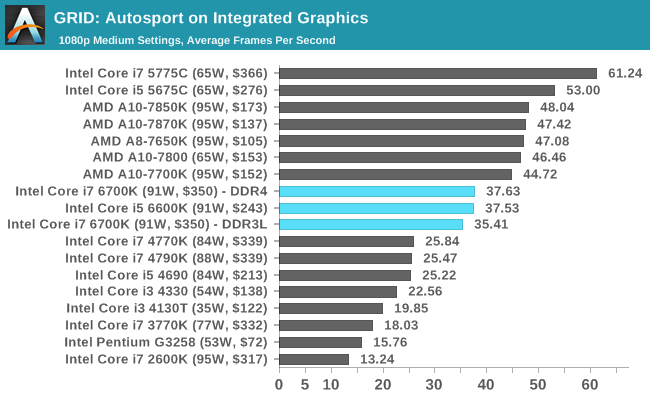
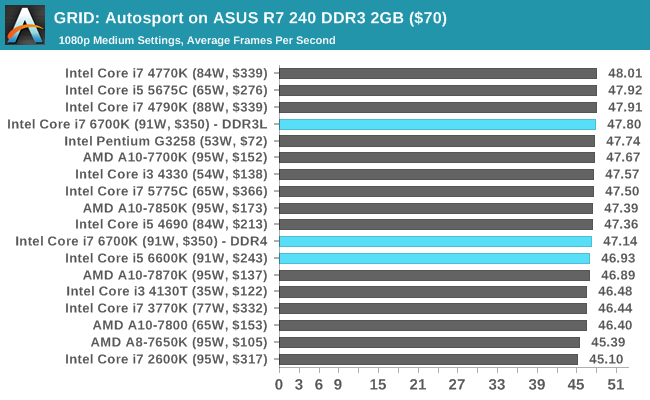
Middle-Earth: Shadow of Mordor
The final title in our testing is another battle of system performance with the open world action-adventure title, Shadow of Mordor. Produced by Monolith using the LithTech Jupiter EX engine and numerous detail add-ons, SoM goes for detail and complexity to a large extent, despite having to be cut down from the original plans. The main story itself was written by the same writer as Red Dead Redemption, and it received Zero Punctuation’s Game of The Year in 2014.
For testing purposes, SoM gives a dynamic screen resolution setting, allowing us to render at high resolutions that are then scaled down to the monitor. As a result, we get several tests using the in-game benchmark. For low end graphics we examine at 720p with low settings, whereas mid and high end graphics get 1080p Ultra. The top graphics test is also redone at 3840x2160, also with Ultra settings, and we also test two cards at 4K where possible.
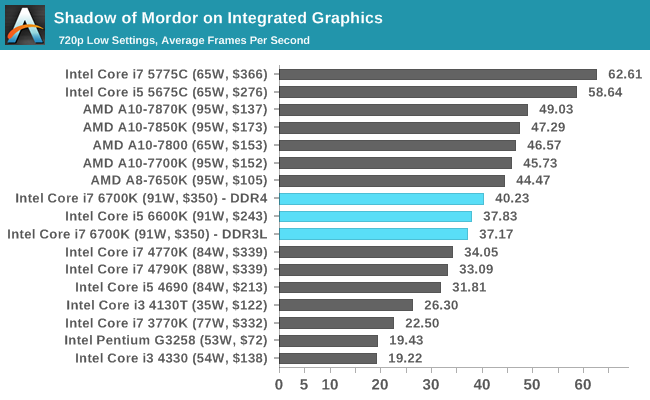
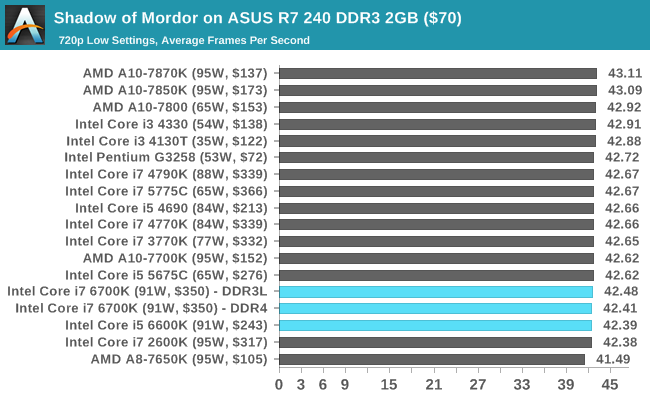
What You Can Buy: Gaming Benchmarks on the Mid-Range
Alien: Isolation
If first person survival mixed with horror is your sort of thing, then Alien: Isolation, based off of the Alien franchise, should be an interesting title. Developed by The Creative Assembly and released in October 2014, Alien: Isolation has won numerous awards from Game Of The Year to several top 10s/25s and Best Horror titles, ratcheting up over a million sales by February 2015. Alien: Isolation uses a custom built engine which includes dynamic sound effects and should be fully multi-core enabled.
For low end graphics, we test at 720p with Ultra settings, whereas for mid and high range graphics we bump this up to 1080p, taking the average frame rate as our marker with a scripted version of the built-in benchmark.
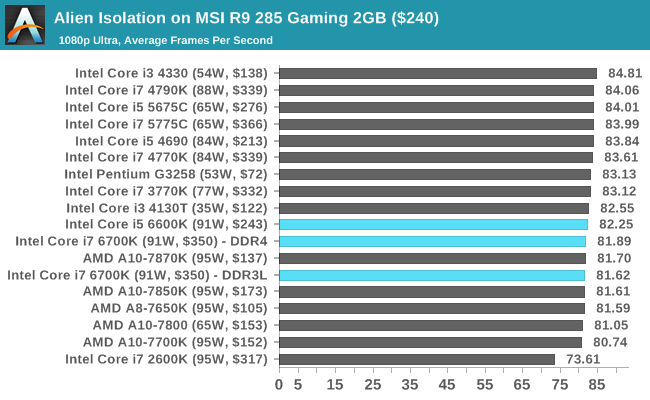
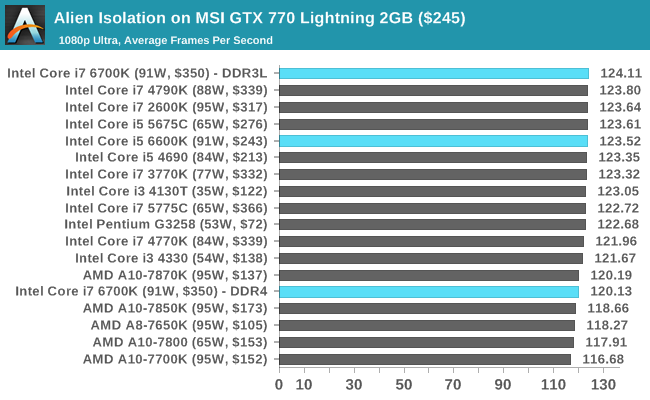
Total War: Attila
The Total War franchise moves on to Attila, another The Creative Assembly development, and is a stand-alone strategy title set in 395AD where the main story line lets the gamer take control of the leader of the Huns in order to conquer parts of the world. Graphically the game can render hundreds/thousands of units on screen at once, all with their individual actions and can put some of the big cards to task.
For low end graphics, we test at 720p with performance settings, recording the average frame rate. With mid and high range graphics, we test at 1080p with the quality setting. In both circumstances, unlimited video memory is enabled and the in-game scripted benchmark is used.
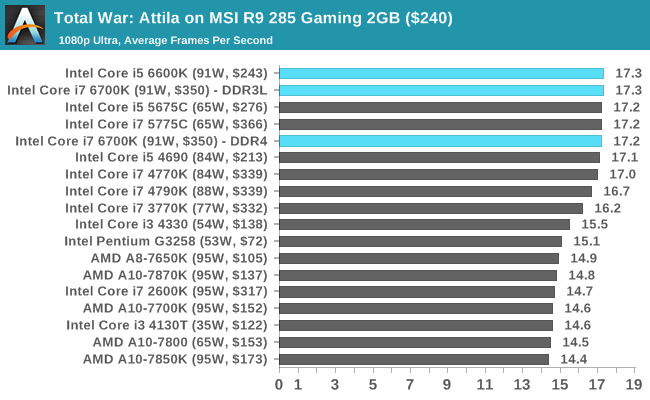
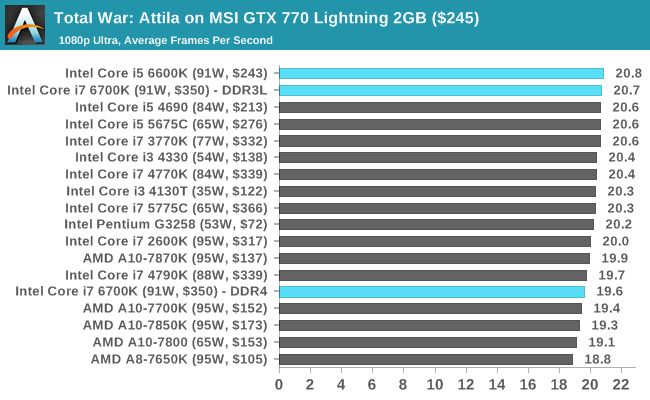
Grand Theft Auto V
The highly anticipated iteration of the Grand Theft Auto franchise finally hit the shelves on April 14th 2015, with both AMD and NVIDIA in tow to help optimize the title. GTA doesn’t provide graphical presets, but opens up the options to users and extends the boundaries by pushing even the hardest systems to the limit using Rockstar’s Advanced Game Engine. Whether the user is flying high in the mountains with long draw distances or dealing with assorted trash in the city, when cranked up to maximum it creates stunning visuals but hard work for both the CPU and the GPU.
For our test we have scripted a version of the in-game benchmark, relying only on the final part which combines a flight scene along with an in-city drive-by followed by a tanker explosion. For low end systems we test at 720p on the lowest settings, whereas mid and high end graphics play at 1080p with very high settings across the board. We record both the average frame rate and the percentage of frames under 60 FPS (16.6ms).
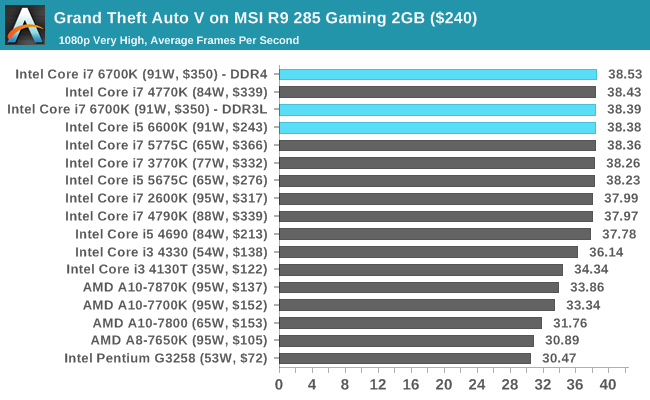
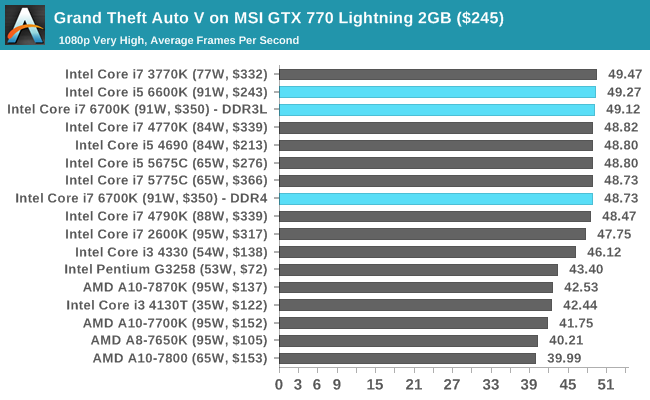
GRID: Autosport
No graphics tests are complete without some input from Codemasters and the EGO engine, which means for this round of testing we point towards GRID: Autosport, the next iteration in the GRID and racing genre. As with our previous racing testing, each update to the engine aims to add in effects, reflections, detail and realism, with Codemasters making ‘authenticity’ a main focal point for this version.
GRID’s benchmark mode is very flexible, and as a result we created a test race using a shortened version of the Red Bull Ring with twelve cars doing two laps. The car is focus starts last and is quite fast, but usually finishes second or third. For low end graphics we test at 1080p medium settings, whereas mid and high end graphics get the full 1080p maximum. Both the average and minimum frame rates are recorded.
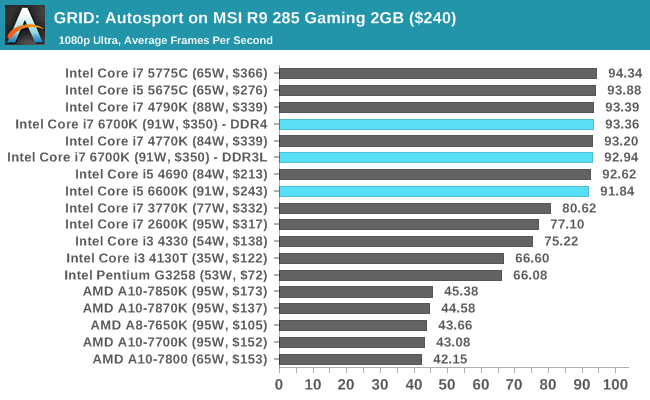
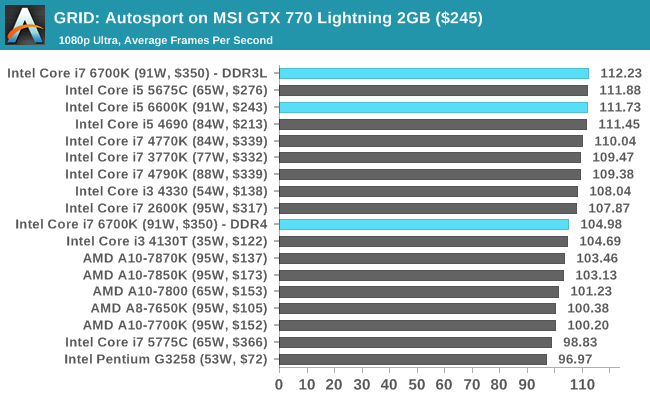
Middle-Earth: Shadow of Mordor
The final title in our testing is another battle of system performance with the open world action-adventure title, Shadow of Mordor. Produced by Monolith using the LithTech Jupiter EX engine and numerous detail add-ons, SoM goes for detail and complexity to a large extent, despite having to be cut down from the original plans. The main story itself was written by the same writer as Red Dead Redemption, and it received Zero Punctuation’s Game of The Year in 2014.
For testing purposes, SoM gives a dynamic screen resolution setting, allowing us to render at high resolutions that are then scaled down to the monitor. As a result, we get several tests using the in-game benchmark. For low end graphics we examine at 720p with low settings, whereas mid and high end graphics get 1080p Ultra. The top graphics test is also redone at 3840x2160, also with Ultra settings, and we also test two cards at 4K where possible.
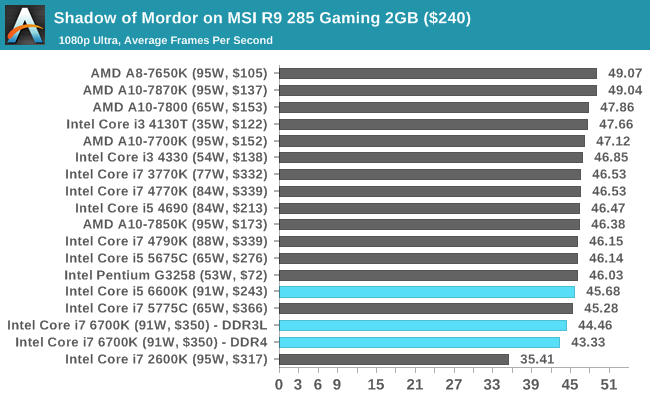
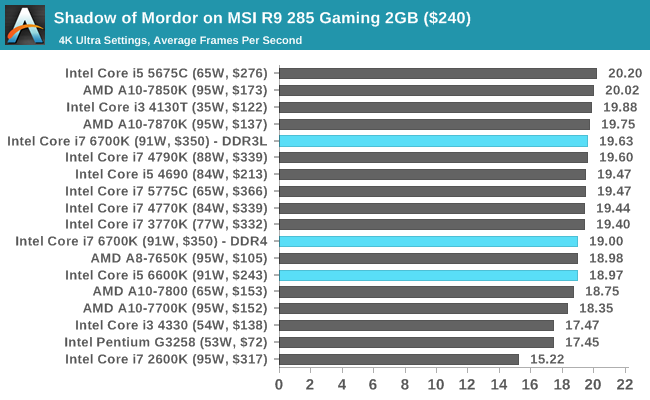
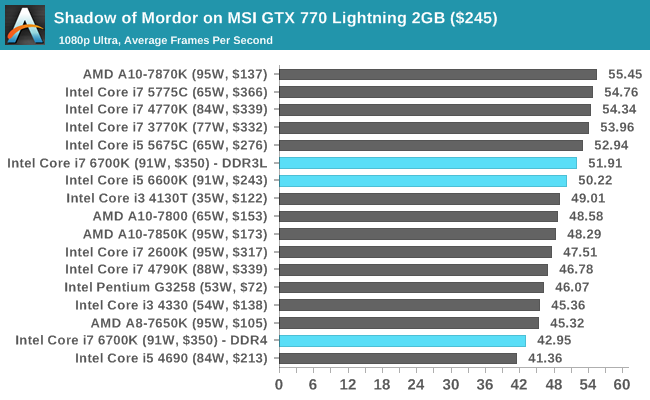
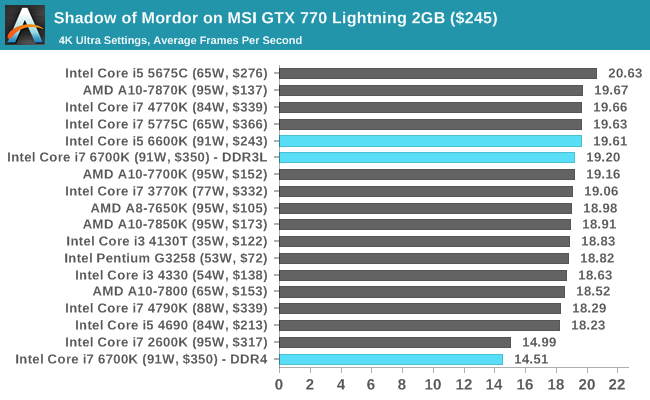
What You Can Buy: Gaming Benchmarks on the High End
Alien: Isolation
If first person survival mixed with horror is your sort of thing, then Alien: Isolation, based off of the Alien franchise, should be an interesting title. Developed by The Creative Assembly and released in October 2014, Alien: Isolation has won numerous awards from Game Of The Year to several top 10s/25s and Best Horror titles, ratcheting up over a million sales by February 2015. Alien: Isolation uses a custom built engine which includes dynamic sound effects and should be fully multi-core enabled.
For low end graphics, we test at 720p with Ultra settings, whereas for mid and high range graphics we bump this up to 1080p, taking the average frame rate as our marker with a scripted version of the built-in benchmark.
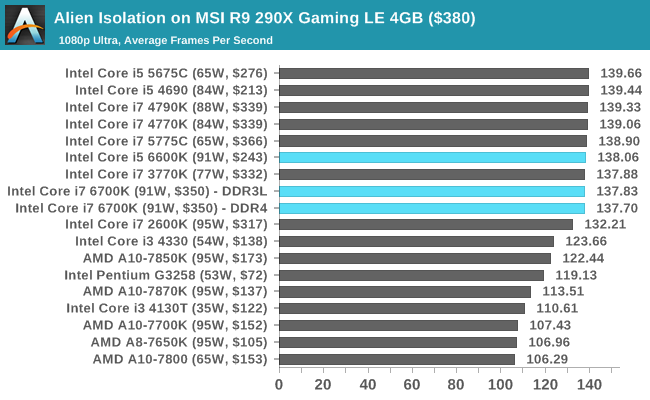
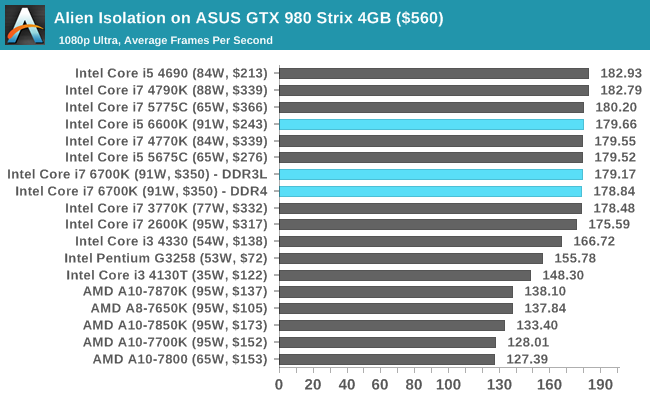
Total War: Attila
The Total War franchise moves on to Attila, another The Creative Assembly development, and is a stand-alone strategy title set in 395AD where the main story line lets the gamer take control of the leader of the Huns in order to conquer parts of the world. Graphically the game can render hundreds/thousands of units on screen at once, all with their individual actions and can put some of the big cards to task.
For low end graphics, we test at 720p with performance settings, recording the average frame rate. With mid and high range graphics, we test at 1080p with the quality setting. In both circumstances, unlimited video memory is enabled and the in-game scripted benchmark is used.
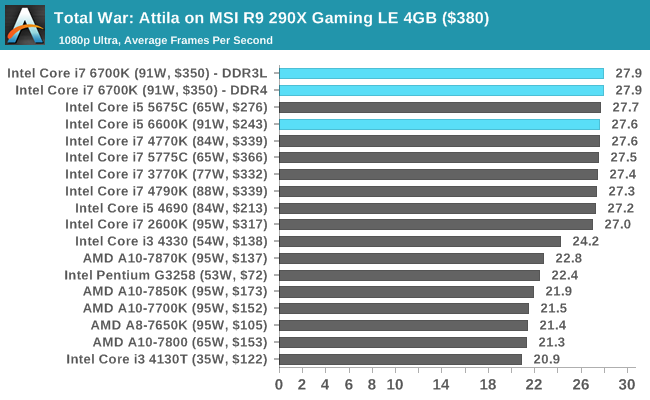
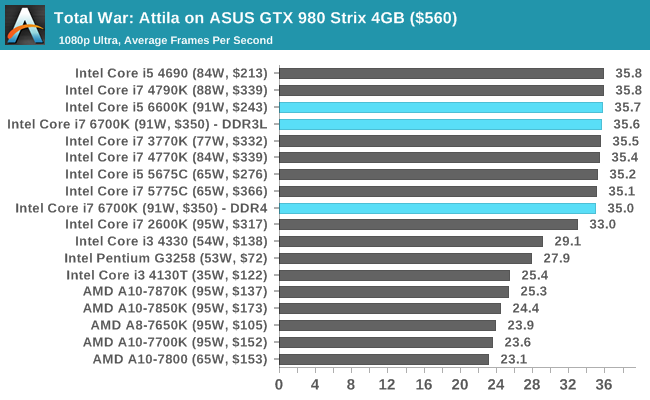
Grand Theft Auto V
The highly anticipated iteration of the Grand Theft Auto franchise finally hit the shelves on April 14th 2015, with both AMD and NVIDIA in tow to help optimize the title. GTA doesn’t provide graphical presets, but opens up the options to users and extends the boundaries by pushing even the hardest systems to the limit using Rockstar’s Advanced Game Engine. Whether the user is flying high in the mountains with long draw distances or dealing with assorted trash in the city, when cranked up to maximum it creates stunning visuals but hard work for both the CPU and the GPU.
For our test we have scripted a version of the in-game benchmark, relying only on the final part which combines a flight scene along with an in-city drive-by followed by a tanker explosion. For low end systems we test at 720p on the lowest settings, whereas mid and high end graphics play at 1080p with very high settings across the board. We record both the average frame rate and the percentage of frames under 60 FPS (16.6ms).
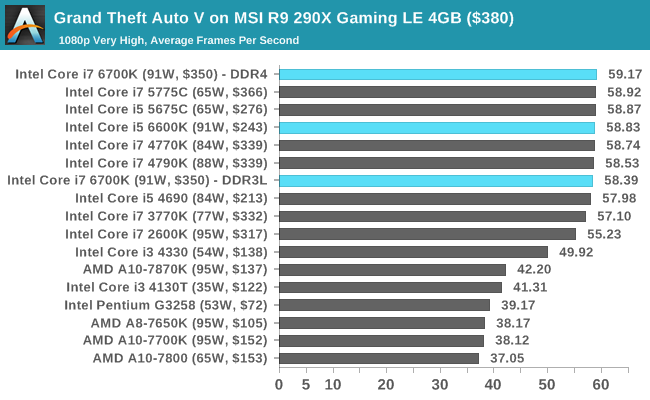
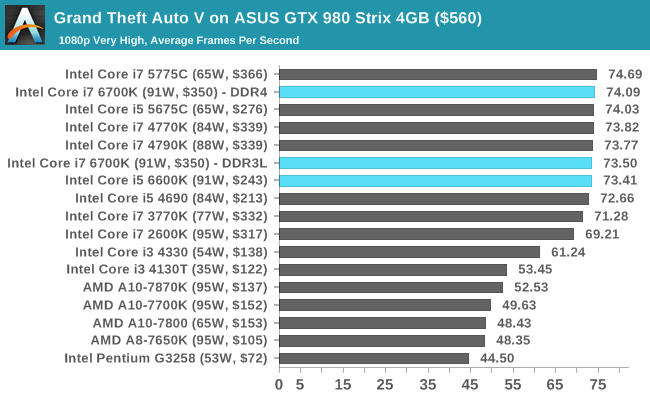
GRID: Autosport
No graphics tests are complete without some input from Codemasters and the EGO engine, which means for this round of testing we point towards GRID: Autosport, the next iteration in the GRID and racing genre. As with our previous racing testing, each update to the engine aims to add in effects, reflections, detail and realism, with Codemasters making ‘authenticity’ a main focal point for this version.
GRID’s benchmark mode is very flexible, and as a result we created a test race using a shortened version of the Red Bull Ring with twelve cars doing two laps. The car is focus starts last and is quite fast, but usually finishes second or third. For low end graphics we test at 1080p medium settings, whereas mid and high end graphics get the full 1080p maximum. Both the average and minimum frame rates are recorded.
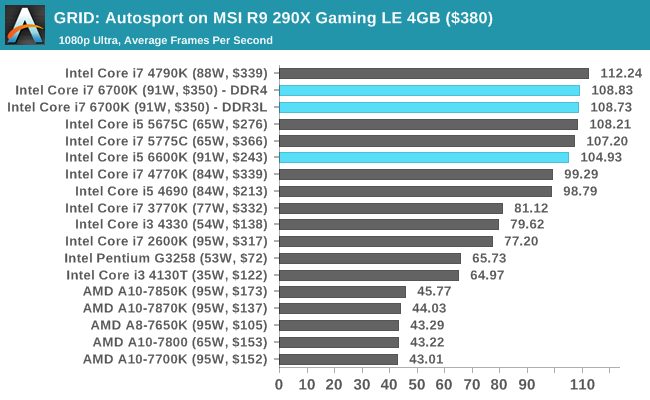
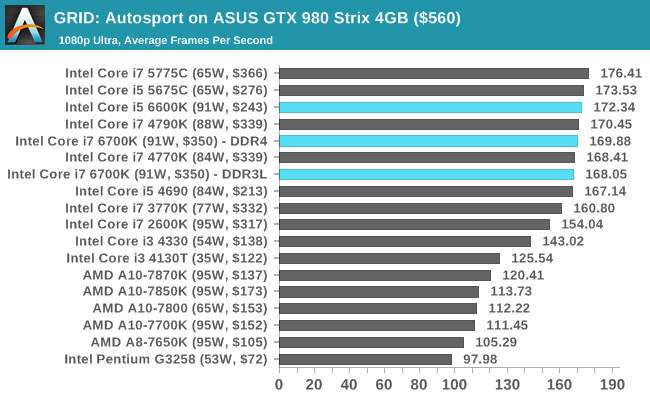
Middle-Earth: Shadow of Mordor
The final title in our testing is another battle of system performance with the open world action-adventure title, Shadow of Mordor. Produced by Monolith using the LithTech Jupiter EX engine and numerous detail add-ons, SoM goes for detail and complexity to a large extent, despite having to be cut down from the original plans. The main story itself was written by the same writer as Red Dead Redemption, and it received Zero Punctuation’s Game of The Year in 2014.
For testing purposes, SoM gives a dynamic screen resolution setting, allowing us to render at high resolutions that are then scaled down to the monitor. As a result, we get several tests using the in-game benchmark. For low end graphics we examine at 720p with low settings, whereas mid and high end graphics get 1080p Ultra. The top graphics test is also redone at 3840x2160, also with Ultra settings, and we also test two cards at 4K where possible.
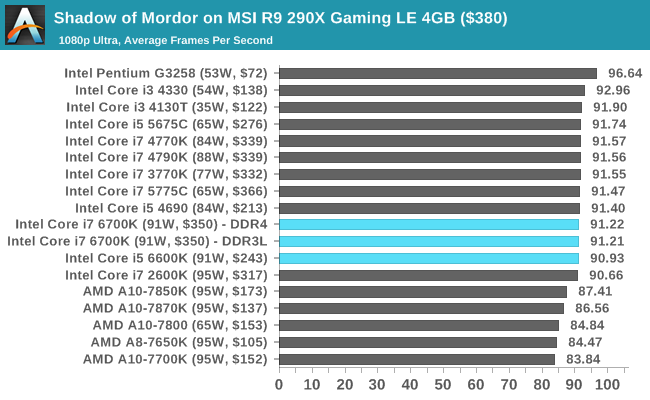
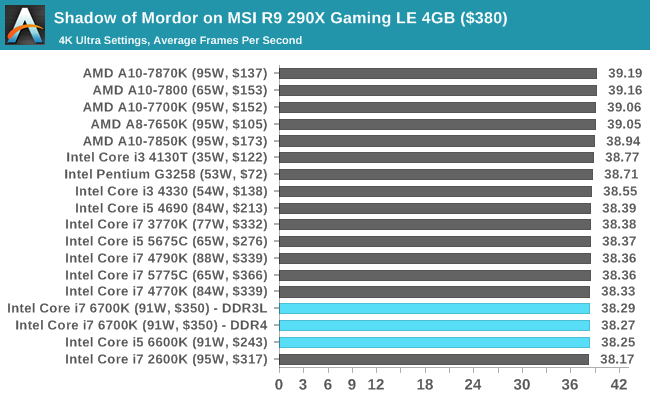
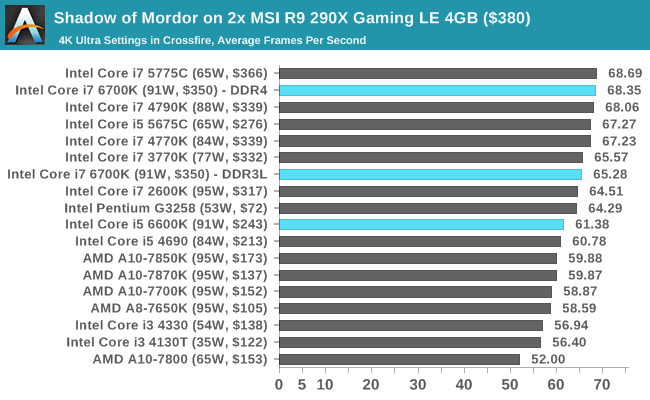
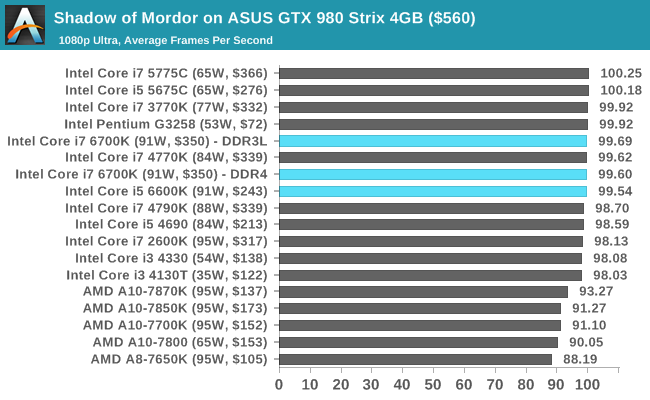
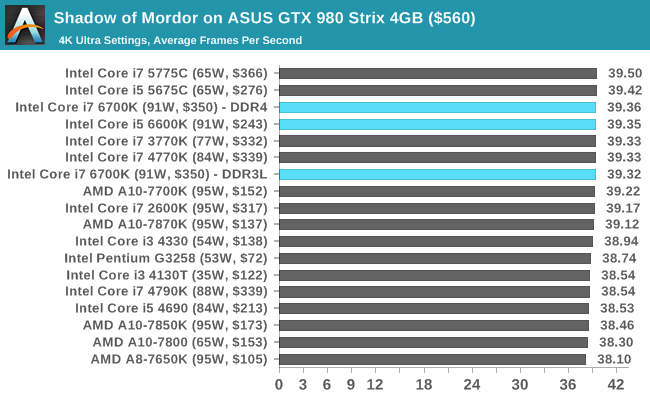
Intel’s 6th Gen Skylake Conclusions
The new 6th Generation Skylake platform from Intel has launched today, and as part of the package there are two new processors, the Core i7-6700K and the Core i5-6600K, a new Z170 motherboard chipset with corresponding motherboards, and also a new market for DDR4 DRAM. The purpose of the Skylake platform launch is to update the mainstream PC market segment for the purposes of better performance and enhanced connectivity.
What is Skylake?
Skylake is a new processor architecture based on Intel’s 14nm process using the newest generation of their FinFET lithographic technology, and the two overclockable K series CPUs are the first processors to be released into the wild. For some this is mildly confusing, given that Intel launched Broadwell for desktop (a die shrink "tick" from 22nm to 14nm) only a couple of months ago. Broadwell has only acted as a minor stopgap measure, fulfilling the requirements of an upgradable platform and taking the crown of the best integrated graphics processor for a socket. As a result of that minor role, a number of users will see Skylake more as an upgrade from Haswell, the last mainstream processor family that had a long market shelf life.
For this launch and review, details about Skylake have been relatively rare to come by even in Intel’s own press documents, and we are set to hear more details at Intel’s Developer Forum in mid-August. Nonetheless, we have been able to determine that Skylake has a raft of updates, focusing on fixed function hardware to accelerate certain workloads as well as decoupling the CPU and PCIe frequency domains on the silicon to allow for more precise overclocking.
The platform changes as well. The voltage regulators inside Haswell CPUs move back out on to the motherboard as they generated too much heat inside the CPU. This is good for overclockers, but means the required components on Z170 motherboards, and price, has the potential to go up. The Z170 chipset is the sole chipset being released today, with others coming later in the year. Z170 features an upgrade to DMI 3.0, giving faster CPU-to-chipset bandwidth and enabling a 26-lane high speed IO hub. Of these lanes, 20 can be configured for PCIe lanes under a strict set of rules, giving access to the potential for more functionality on board. Most motherboards being launched today will use these lanes to provide M.2 slots, USB 3.1 Gen 2 ports via controllers, extra networking, extra PCIe slots and SATA Express connectivity. In our motherboard overview we have details on over 55 motherboards to look through.
The Results
Overall, Skylake is not an earth shattering leap in performance. In our IPC testing, with CPUs at 3 GHz, we saw a 5.7% increase in performance over a Haswell processor at the same clockspeed and ~ 25% gains over Sandy Bridge. That 5.7% value masks the fact that between Haswell and Skylake, we have Broadwell, marking a 5.7% increase for a two generation gap.
In our discrete gaming benchmarks, at 3GHz Skylake actually performs worse than Haswell at an equivalent clockspeed, giving up an average of 1.3% performance. We don’t have much from Intel as to analyze the architecture to see why this happens, and it is pretty arguable that it is noticeable, but it is there. Hopefully this is just a teething issue with the new platform.
When we ratchet the CPUs back up to their regular, stock clockspeeds, we see a gap worth discussing. Overall at stock, the i7-6700K is an average 37% faster than Sandy Bridge in CPU benchmarks, 19% faster than the i7-4770K, and 5% faster than the Devil’s Canyon based i7-4790K. Certain benchmarks like HandBrake, Hybrid x265, and Google Octane get substantially bigger gains, suggesting that Skylake’s strengths may lie in fixed function hardware under the hood.
In full speed gaming benchmarks we have some situations that benefit from Skylake (GRID on high end graphics cards) and others that drop (Mordor on GTX 770), but the important aspect to consider is despite Skylake supporting both DDR3L and DDR4 memory, our results show that even with a fast DDR3 kit, a default-speed DDR4 set of memory is still worth upgrading to. On average there’s a small change in performance in favor of the DDR4 (especially in integrated graphics), but DDR4 confers benefits such as more memory per module and lower voltages to aid power consumption
A quick turn to the overclocking situation on Skylake: from our small sample set, most of the CPUs achieved 4.6 GHz when pushing and 4.5 GHz comfortably, including the retail sample that had 4.5 GHz. Speaking to other reviewers, their results match us or even slightly better our own, with one report of a 5.0 GHz gem of a processor. From our testing, Skylake seems to have more of a temperature barrier than a voltage barrier, so increasing the cooling seems to be the task of the day here to get the high frequencies.
With all that, I’m going to make a bold statement.
Sandy Bridge, Your Time Is Up.
A large number of users invested into Intel based platforms during the Core 2 Quad, Nehalem and Sandy Bridge releases. Sandy Bridge was notable because it inferred a large performance gain at stock speeds, and with a good processor anyone could reach 4.7 GHz and even higher using a good high end cooler. With that, Intel has had a problem enticing these users to upgrade because their performance has been constantly matched by Ivy Bridge, Haswell and Broadwell – for every 5% IPC increase from the CPU, an average 200 MHz was lost on the good overclock and they would have to find a good overclocking CPU again. There was no great reason, apart from chipset functionality to upgrade.
That changes with Skylake.
From a clock-to-clock performance perspective, Skylake gives an average ~25% better performance in CPU based benchmarks, and when running both generations of processors at their stock speeds that increase jumps up to 37%. In specific tests, it is even higher. When you scale up to a 4.5 GHz Skylake against a 4.7 GHz Sandy Bridge, the 4% frequency difference is only a tiny portion of that. There are other added benefits, such as the move to a DDR4 memory topology that has denser memory modules, as well as PCIe storage and even PCIe 3.0 graphics connectivity.
As I said above, Skylake is not necessarily the most ground breaking architecture over Haswell. It affords a 19% CPU performance gain over the i7-4770K and 5% over the i7-4790K. There is a small minor issue with gaming that disappears when you use synthetics, but only to the tune of a couple of percentage points. For that minor hit, the package combo of processor, chipset and DDR4 should be an intrigue in the minds of Sandy Bridge (and older) owners.
What Happens Now?
Next on the list for us is Intel’s Developer Forum in mid-August. Here Intel has said they will present details on their Skylake architecture and it will hopefully shed some further insight into what is going on under the hood with Skylake. We will have a full write up for you after the event.
There is still the rest of the Skylake stack to be released – non overclocking processors, low power processors, and the B/H/Q chipsets too. There is no official date on these except ‘later in the year’. We will also get to these when we have more information.


