Original Link: https://www.anandtech.com/show/14089/asrock-deskmini-310-review
The ASRock DeskMini 310 Mini-PC Review: A Cost-Effective Mini-STX Platform
by Ganesh T S on March 15, 2019 9:30 AM EST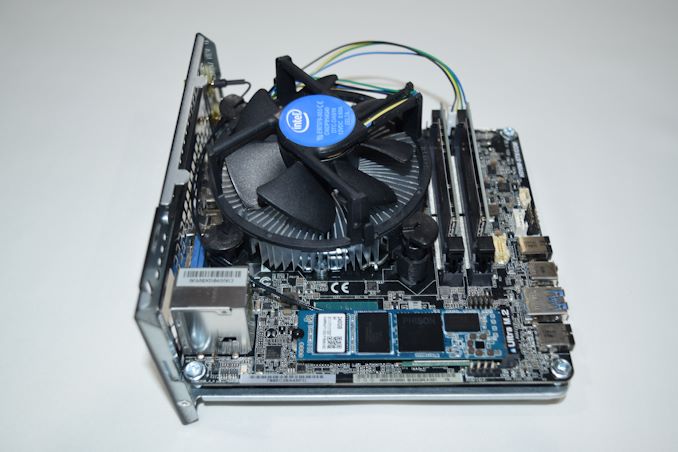
Small form-factor PCs and gaming systems have emerged as bright spots in the mature PC market over the last decade or so. Intel's NUC form-factor introduction was the turning point in the SFF segment, though it came with a few limitations for DIY enthusiasts. While mini-ITX systems are quite flexible and compact, Intel realized that the market could do with an option between the NUC and the mini-ITX systems. The mini-STX (5-inch by 5-inch, known as '5x5') form-factor was launched in 2015. ASRock and ECS have introduced a number of mini-STX form-factor boards and systems. Today, we are taking a look at a low-cost H310 chipset-based mini-STX system from ASRock: the DeskMini 310.
The ASRock DeskMini 310: Barebones Going Small
ASRock was one of the pioneers in the SFF PC space with their Core and Vision series of products using customized boards. After Intel's NUC and mini-STX became popular, the company introduced the Beebox (NUC clone) and the DeskMini (mini-STX and micro-STX) series into the market. The DeskMini units are sold as barebone packages, coming with the chassis, motherboard, power supply, Wi-Fi module, and assorted cables. Users need to supply a CPU, a CPU cooler, DRAM, and storage.
We have reviewed the DeskMini 110 mini-STX barebones PC back in mid-2016, and the DeskMini Z370 micro-STX PC (with a GTX 1060 discrete GPU in a MXM card) in mid-2018. The DeskMini 310 that we are looking at today is a follow-up product to the DeskMini 110. While the DeskMini 110 was based on the Intel H110 chipset and supported the LGA 1151 Skylake processors, the DeskMini 310 is based on the Intel H310 chipset and supports the 8th Generation and 9th Generation Intel processors. Similar to the DeskMini 110, the 310 also supports the stock Intel cooler and can accommodate processors with TDP of up to 65W.
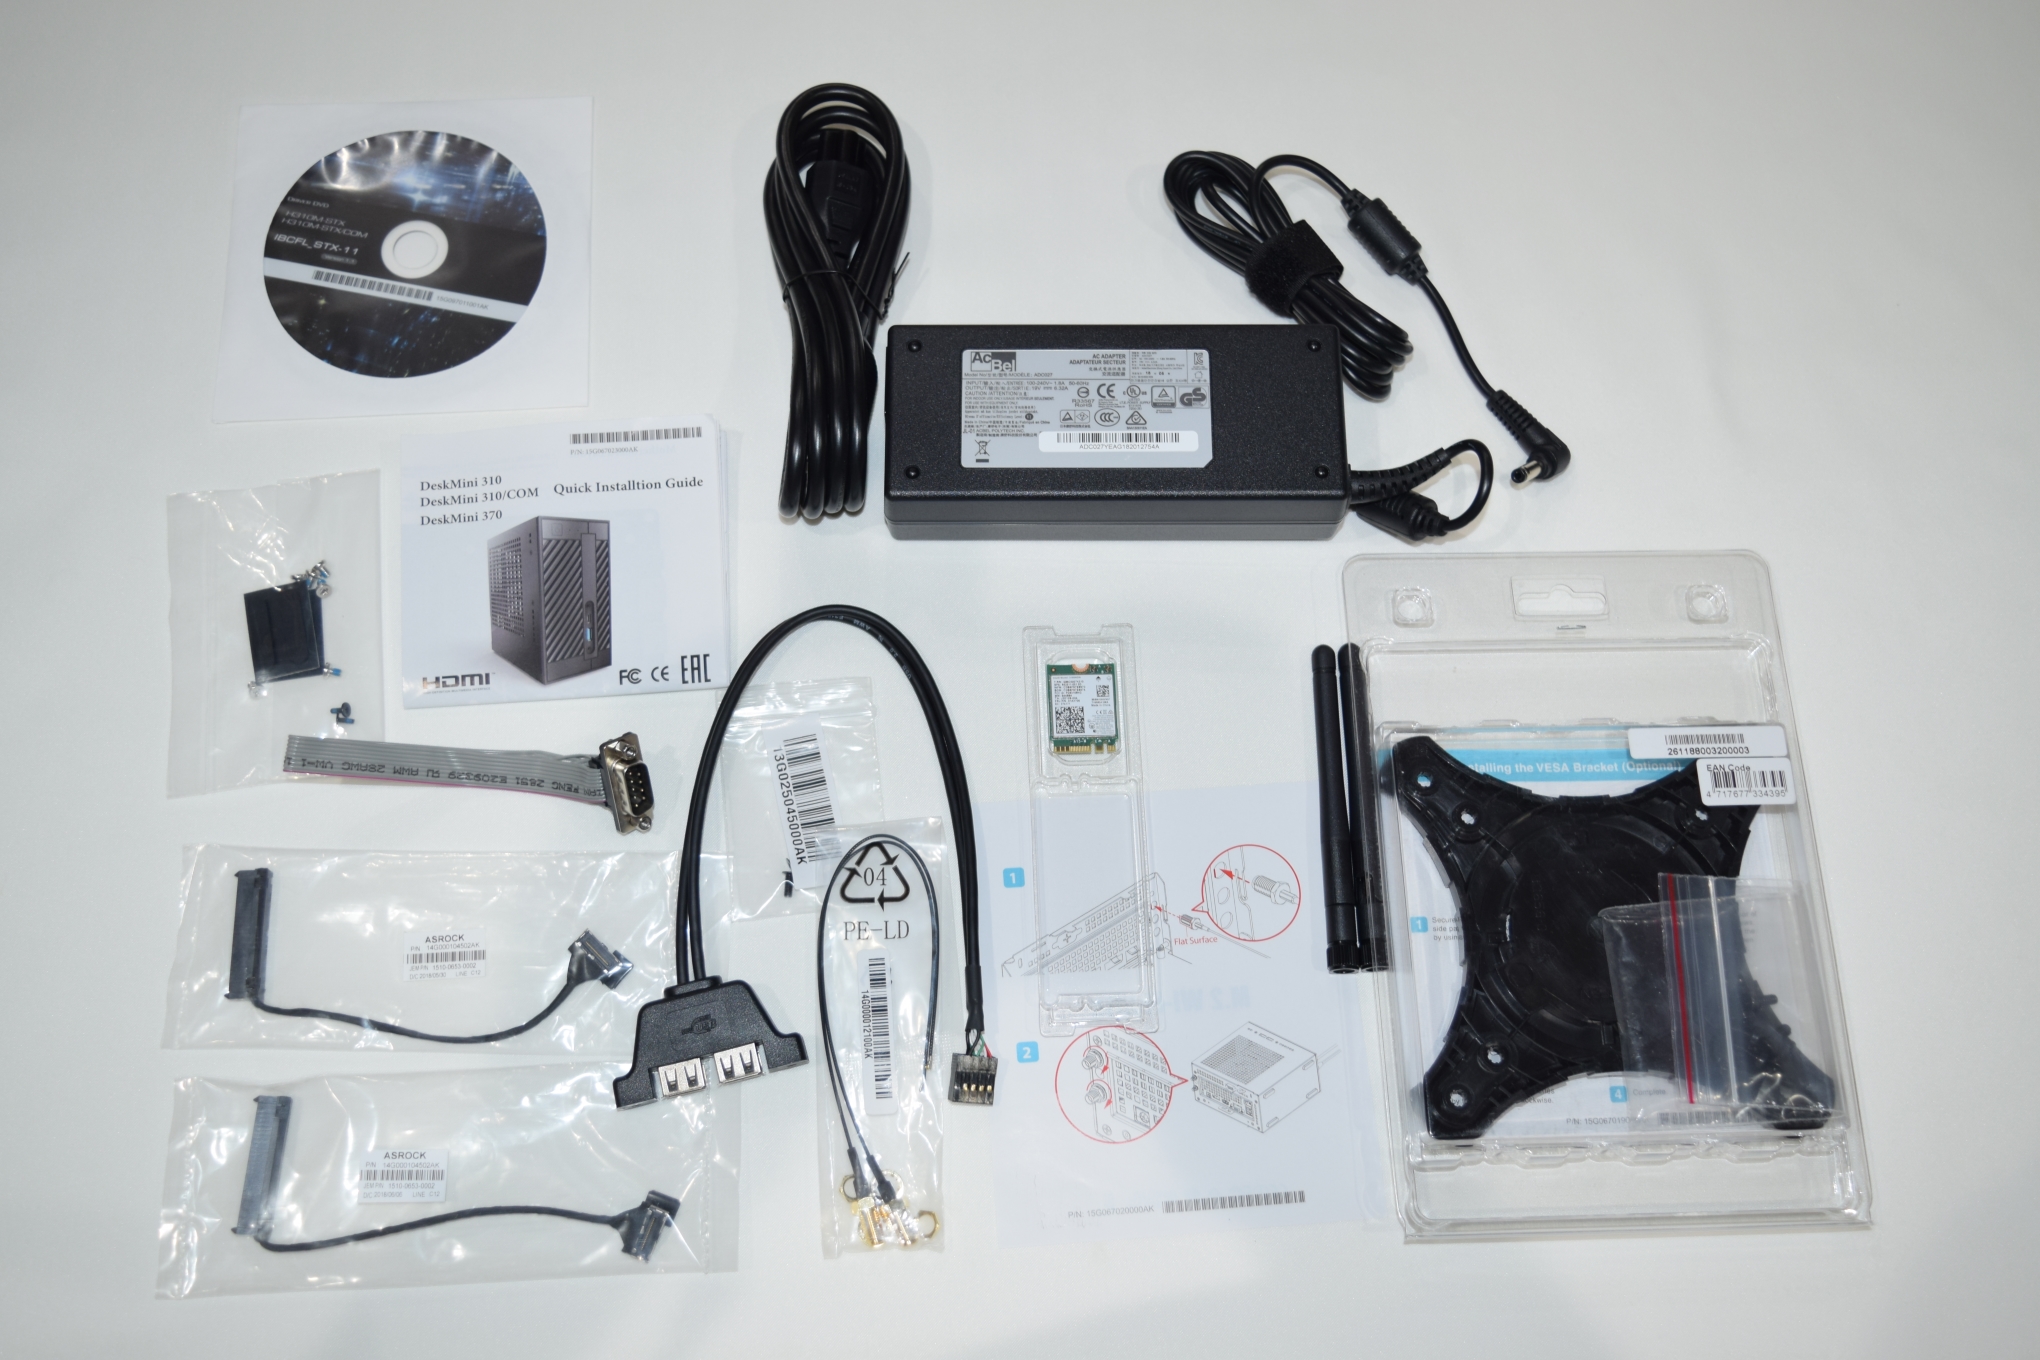
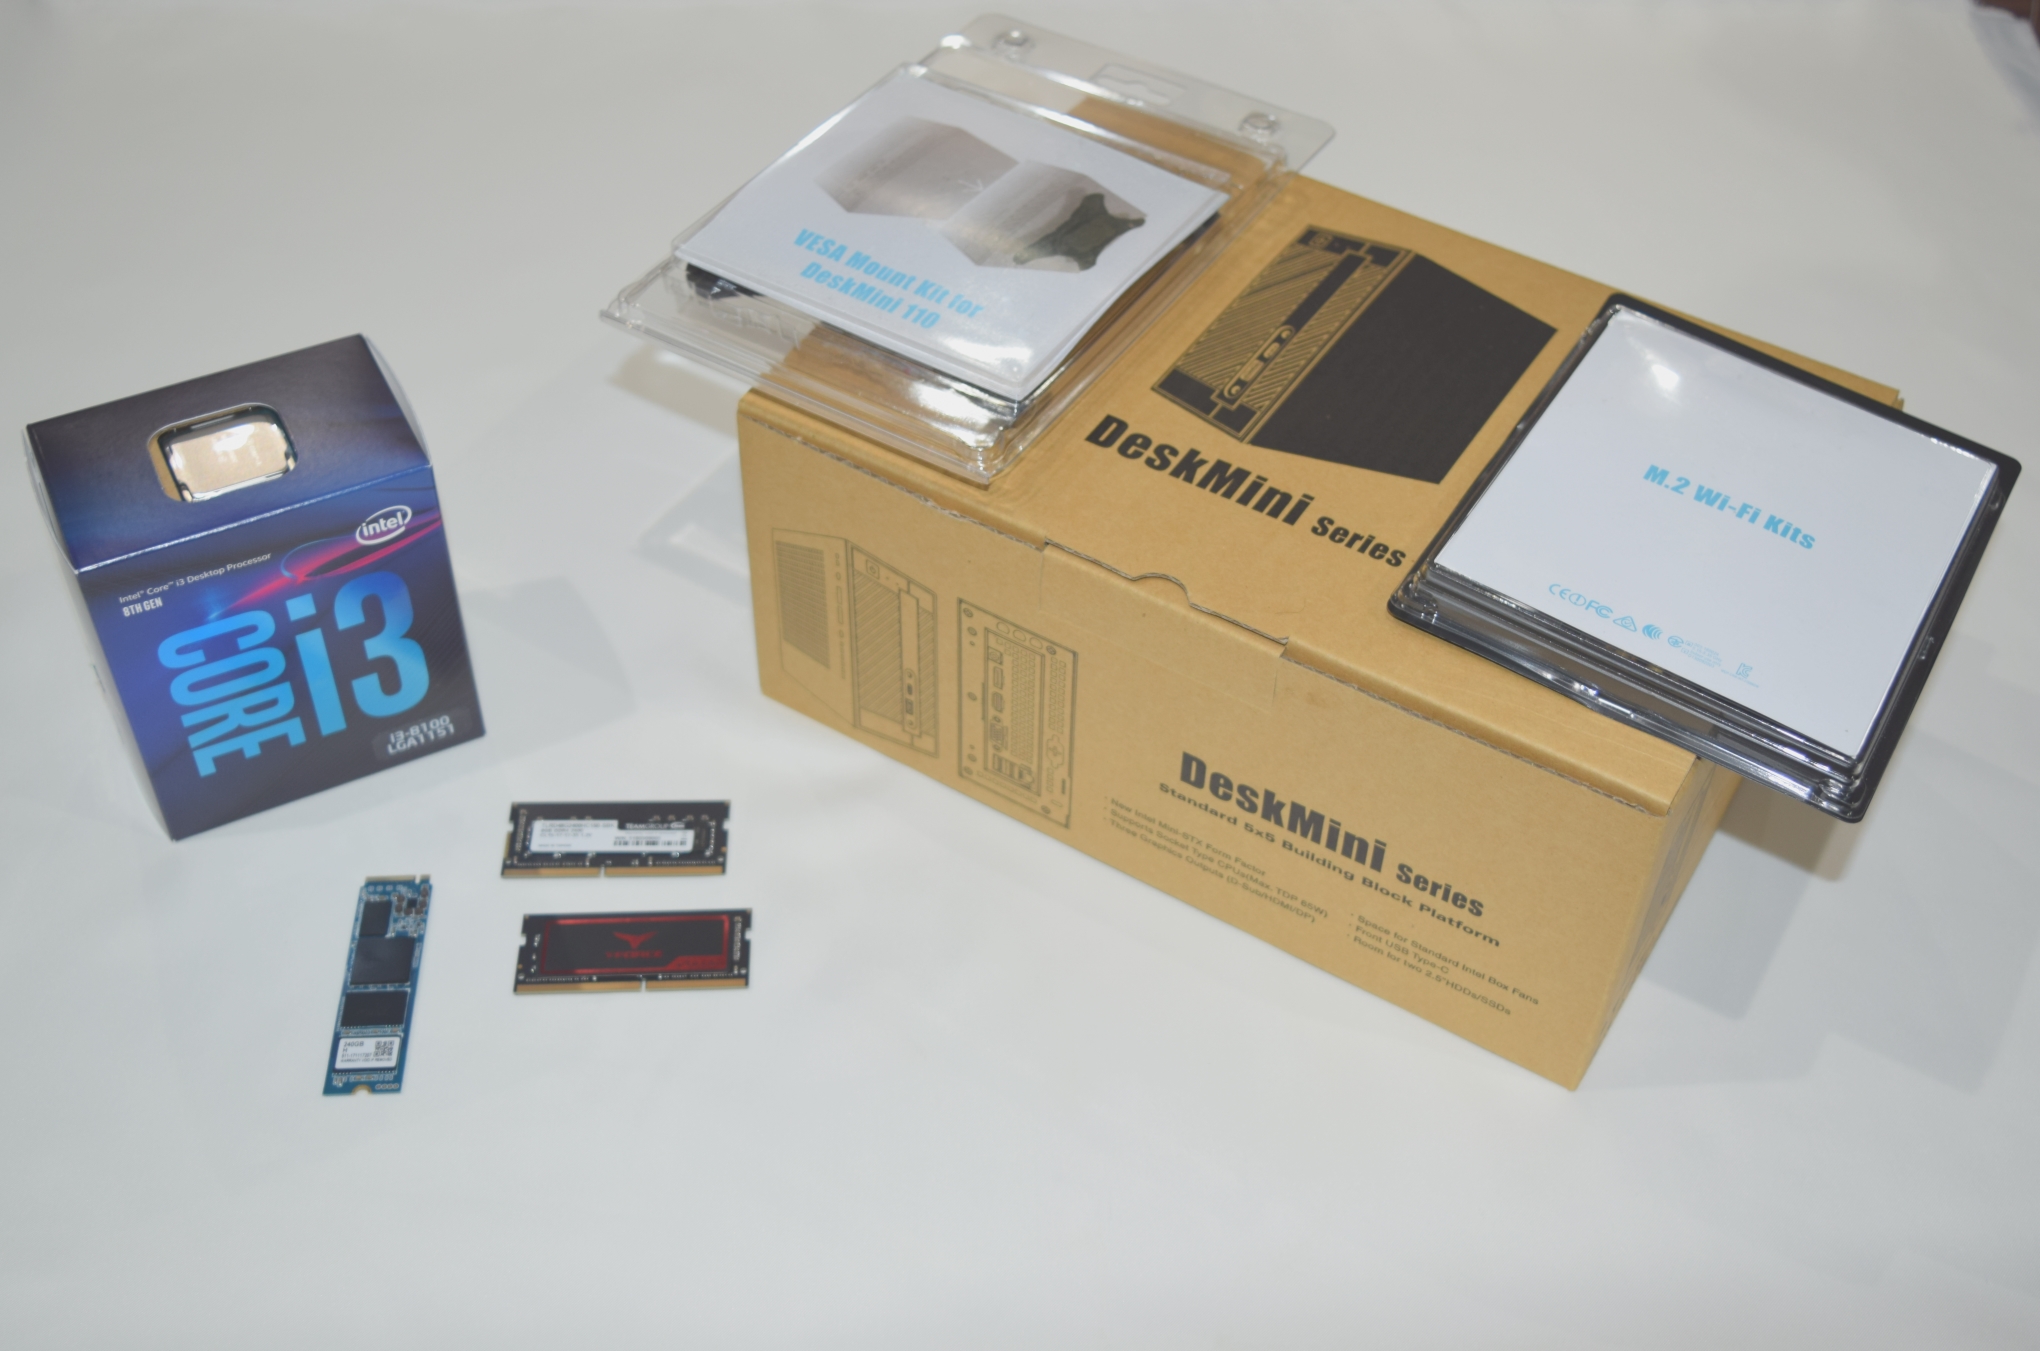
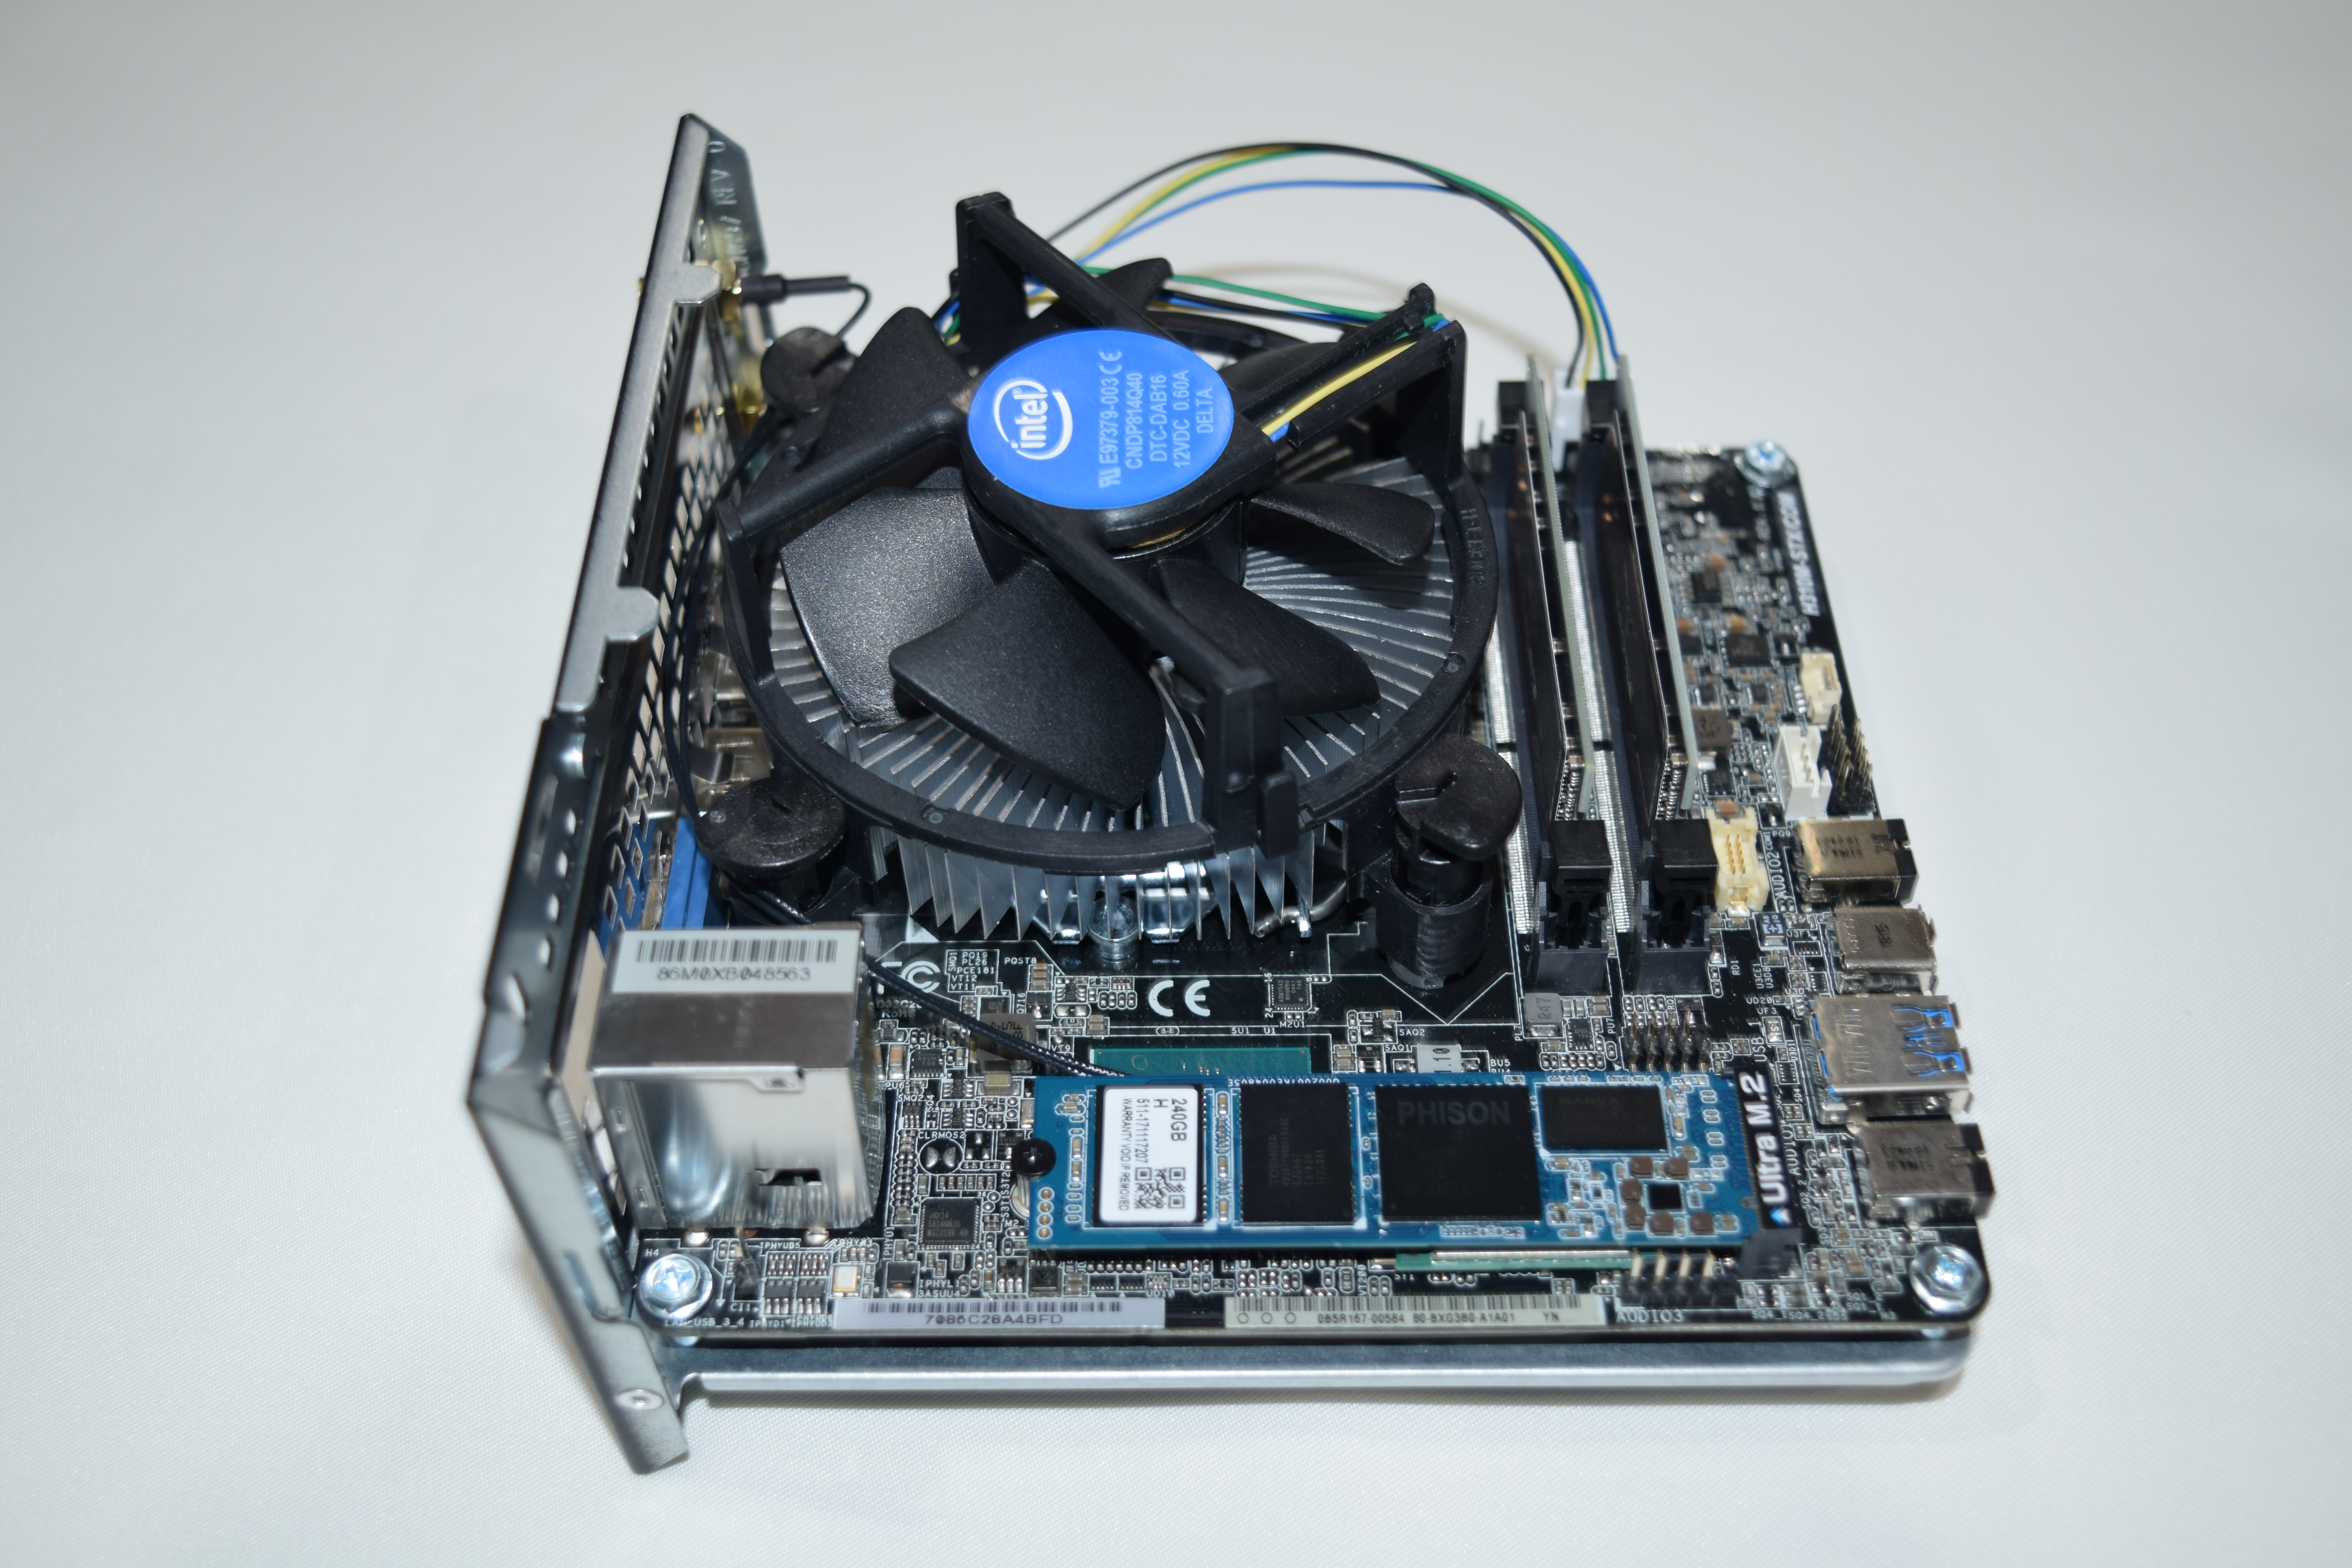
The DeskMini 310 comes with the motherboard pre-installed in the chassis. Users need to supply their own CPU, DDR4 SODIMMs, and M.2 PCIe SSD and/or 2.5" drives. Installing them involves the removal of four screws and pulling out of the motherboard tray. The M.2 Wi-Fi module comes in a separate package (as shown in the above picture) and is not pre-installed. The other cables (such as the dual USB 2.0 port cable for connecting to the motherboard's USB 2.0 header, the serial port cable, and the SATA connectors) also need to be user-installed. The package also comes with a 120W (19V @ 6.32A) power adapter
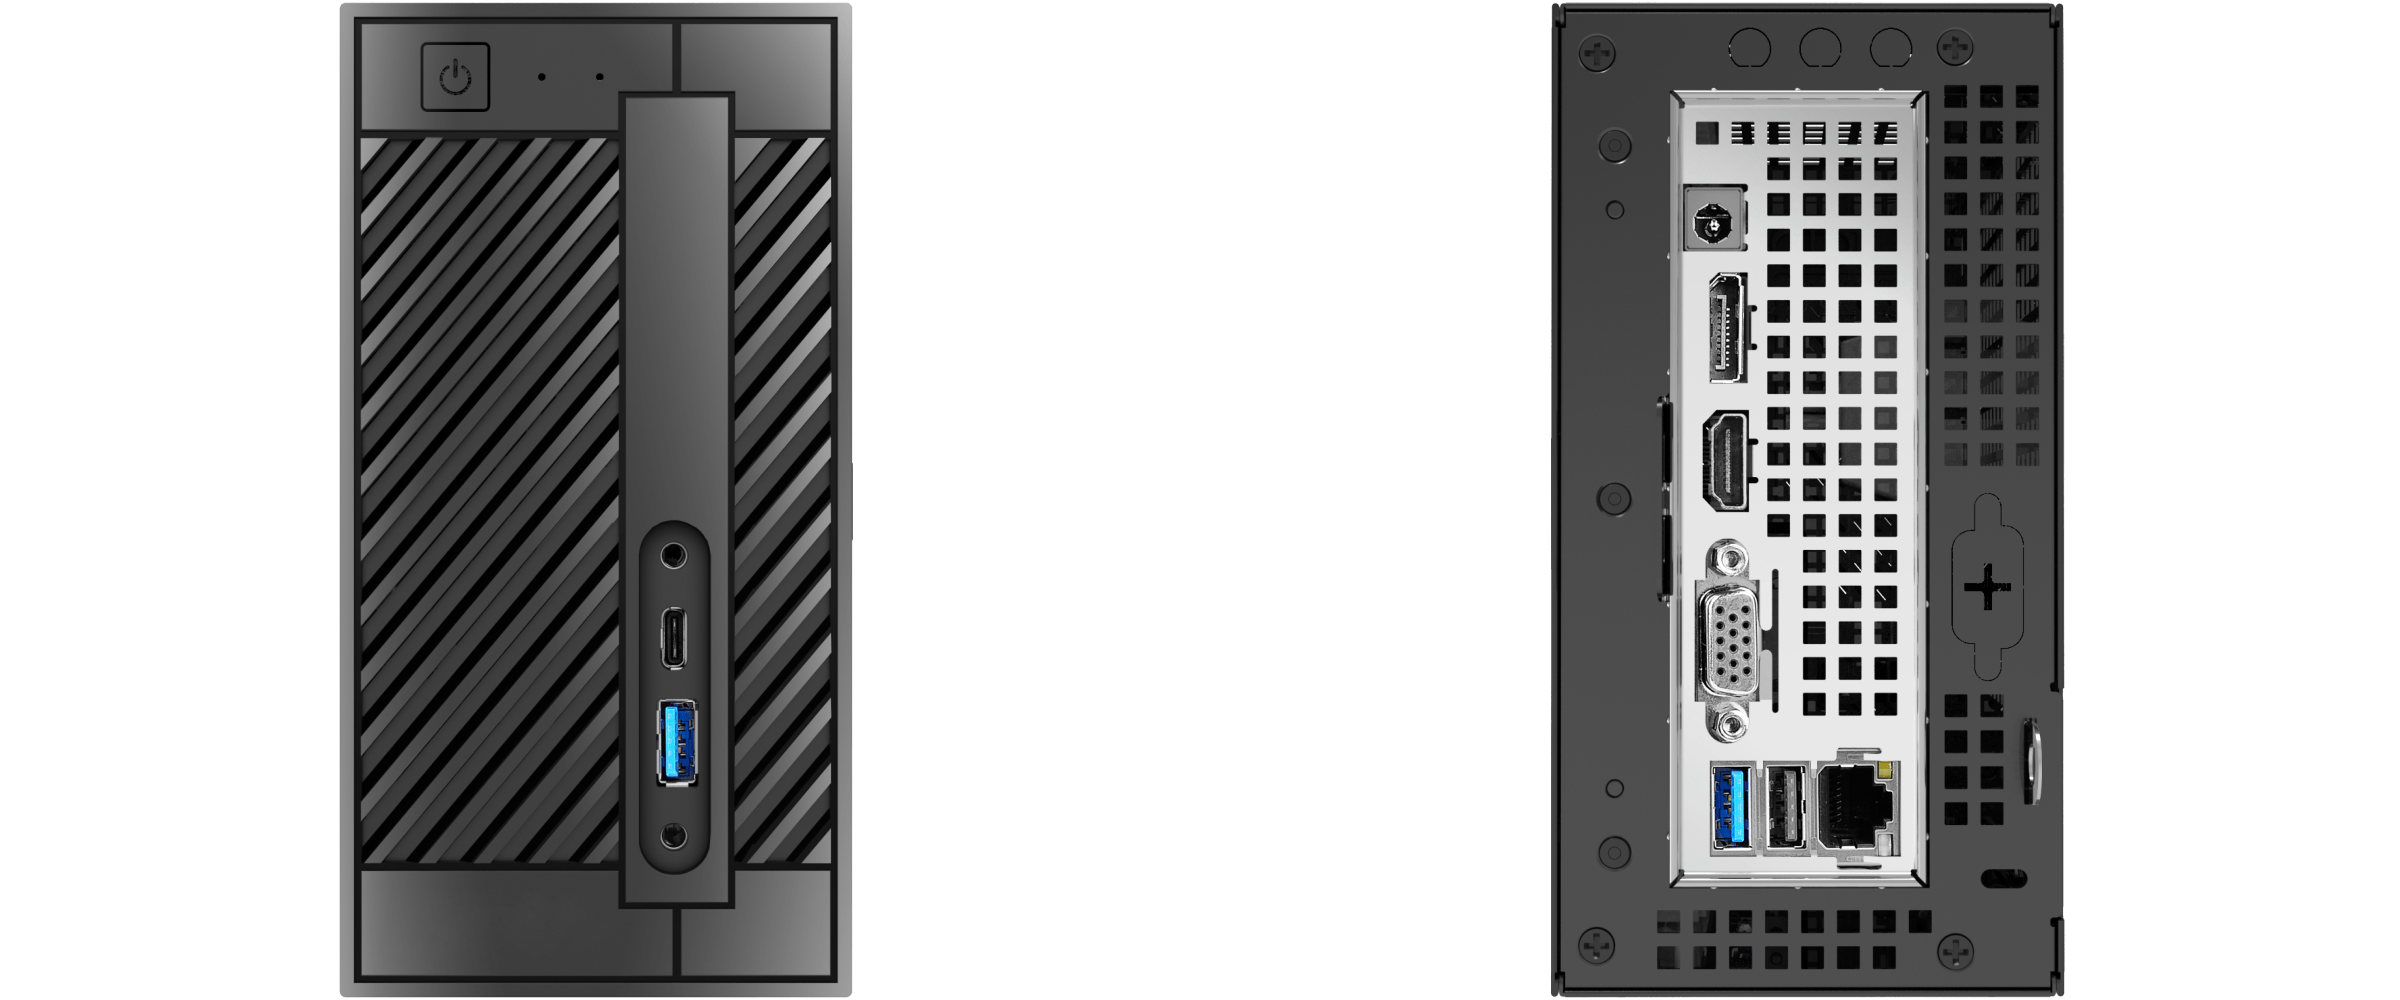
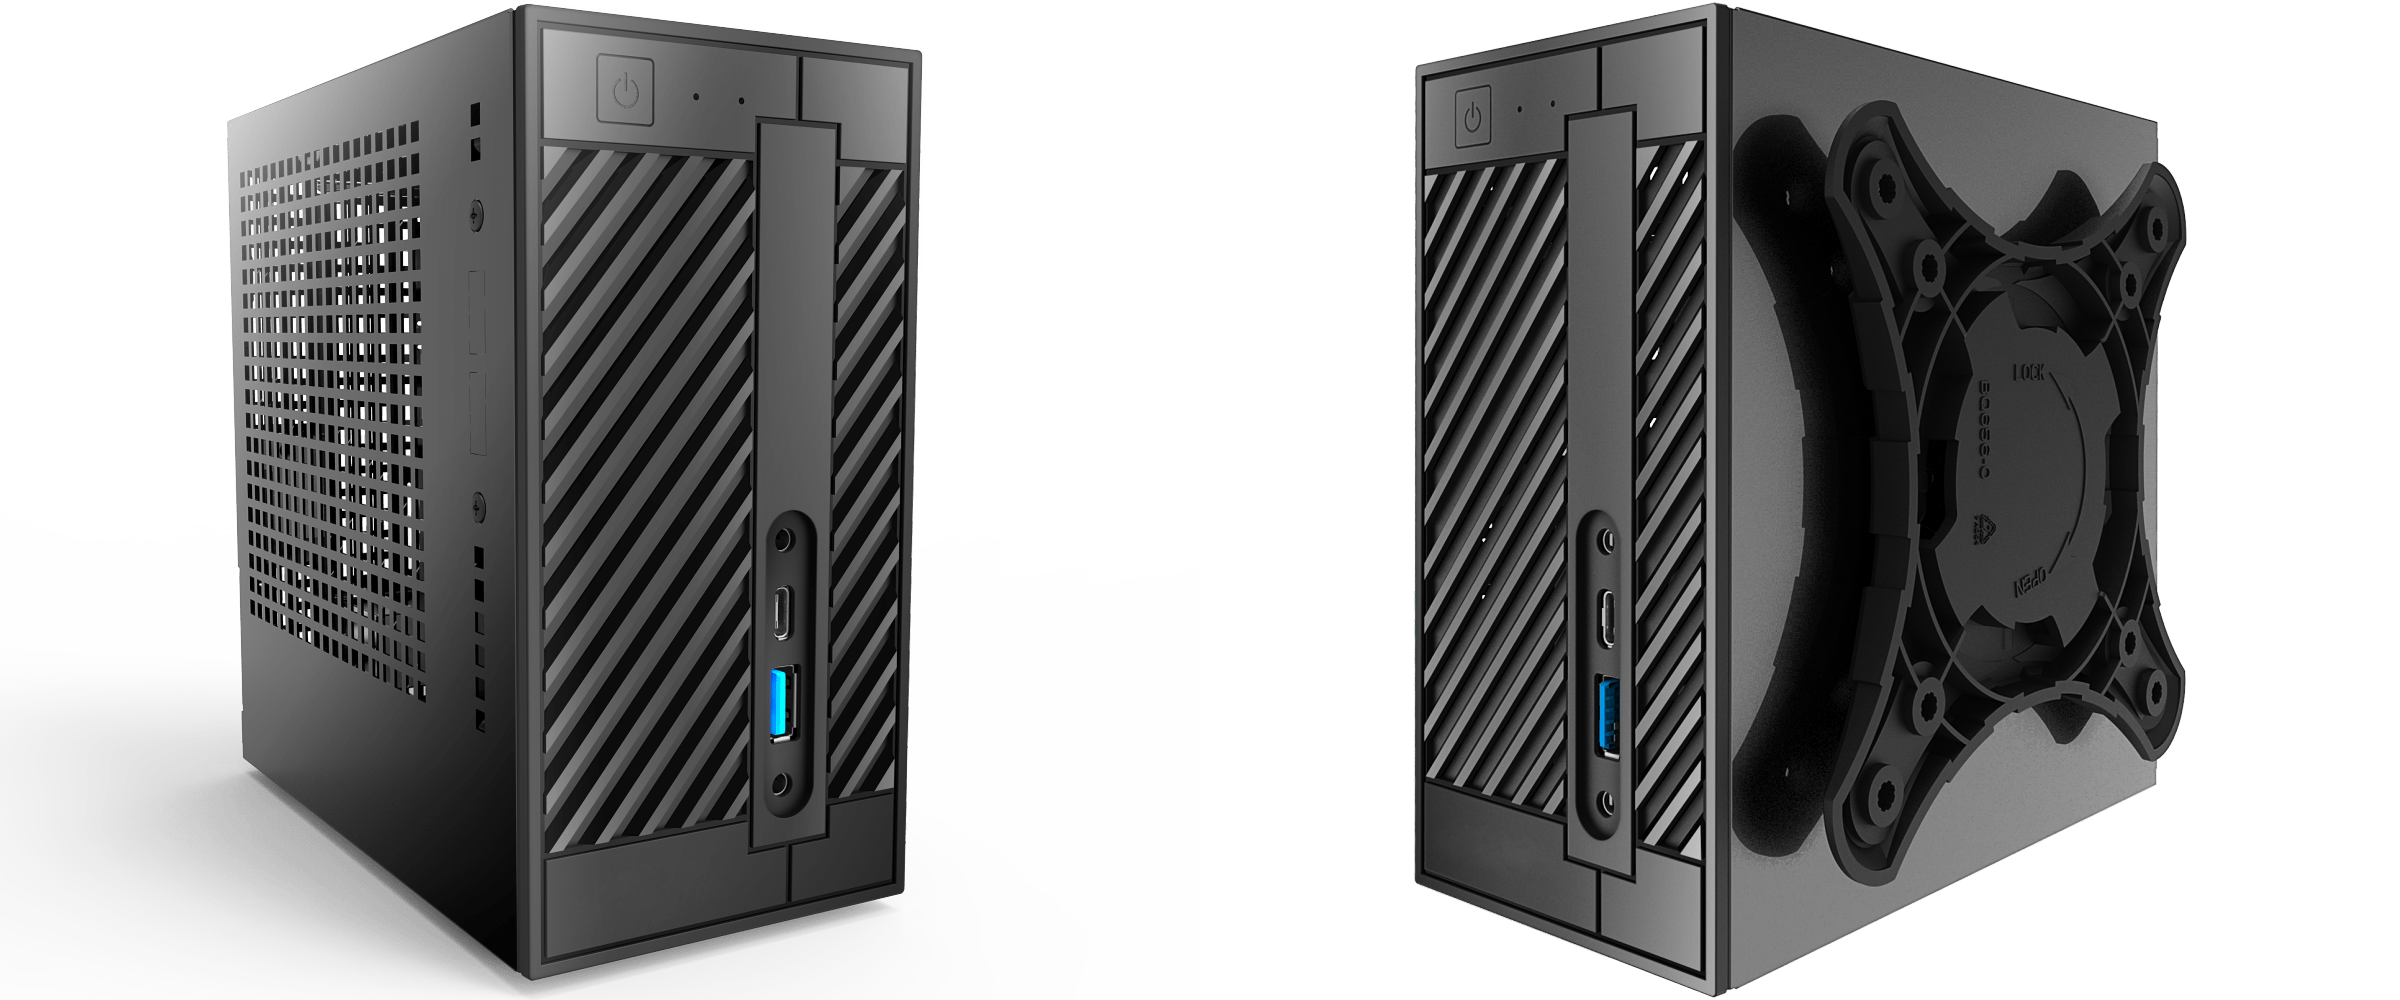
The chassis of the DeskMini 310 is barely different from that of the DeskMini 110. The only update is the presence of two USB 2.0 ports on the left side panel (assuming the system is oriented vertically) - we saw this in the DeskMini Z370, and we are glad that the feature also makes it to the DeskMini 310. The location of these two USB 2.0 ports makes them perfect for plugging in the receivers for wireless keyboards and mice.
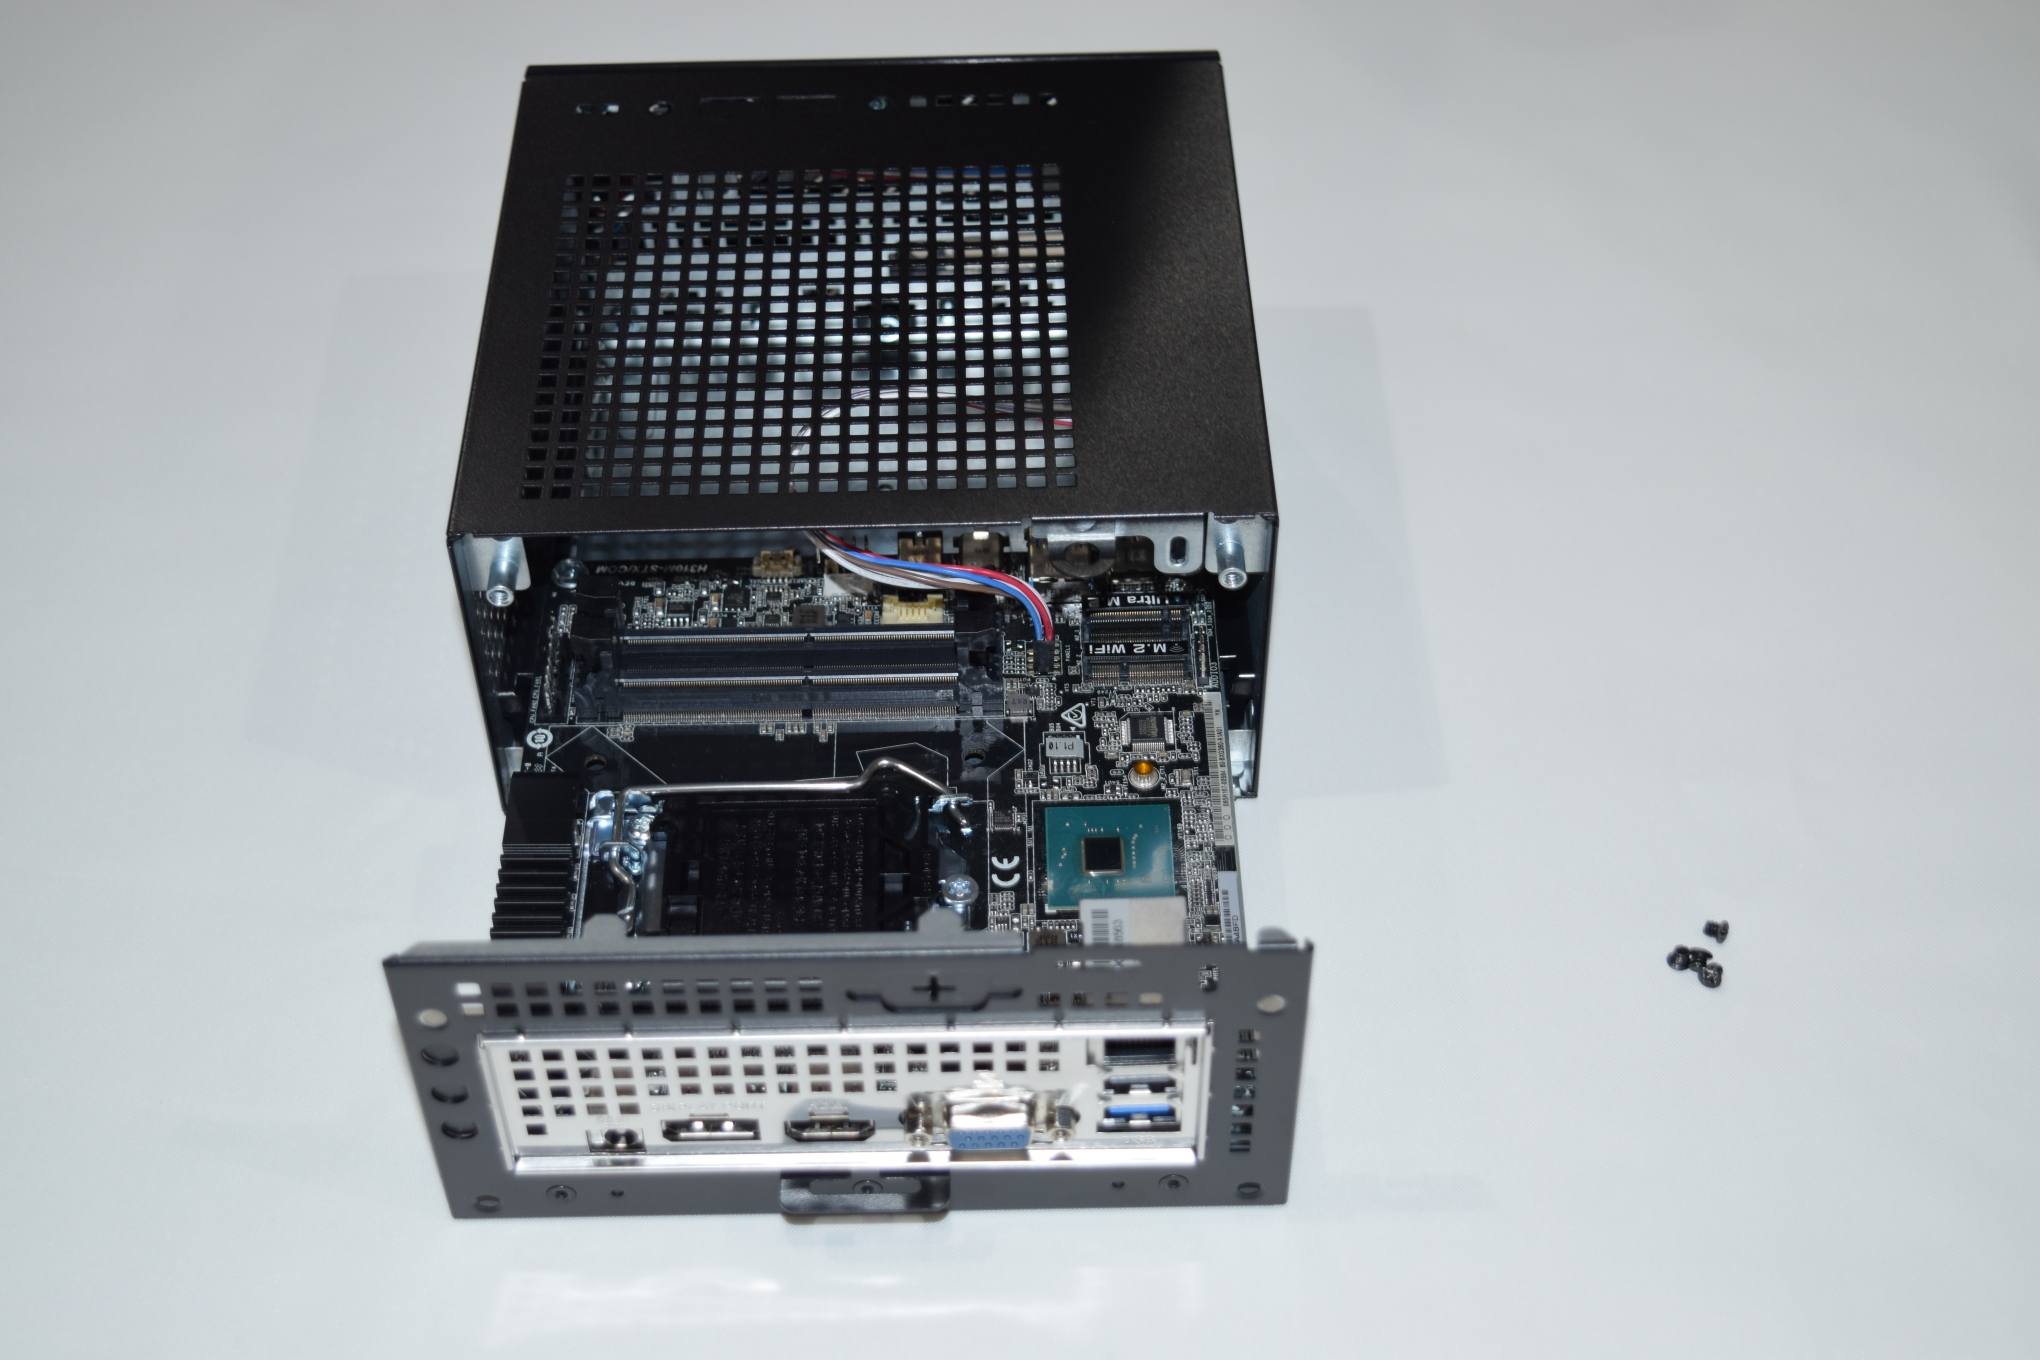
Moving on to the features of the motherboard itself, we find the DeskMini 310 enabling the M.2 SSD slot with four PCIe 3.0 lanes directly from the CPU. The PCIe lanes off the H310 chipset are used by the Wi-Fi module. The main difference compared to the DeskMini 110 board is the presence of a micro-SD slot. Other features (such as the ability to accommodate two 2.5" drives) are carried over from the DeskMini 110.
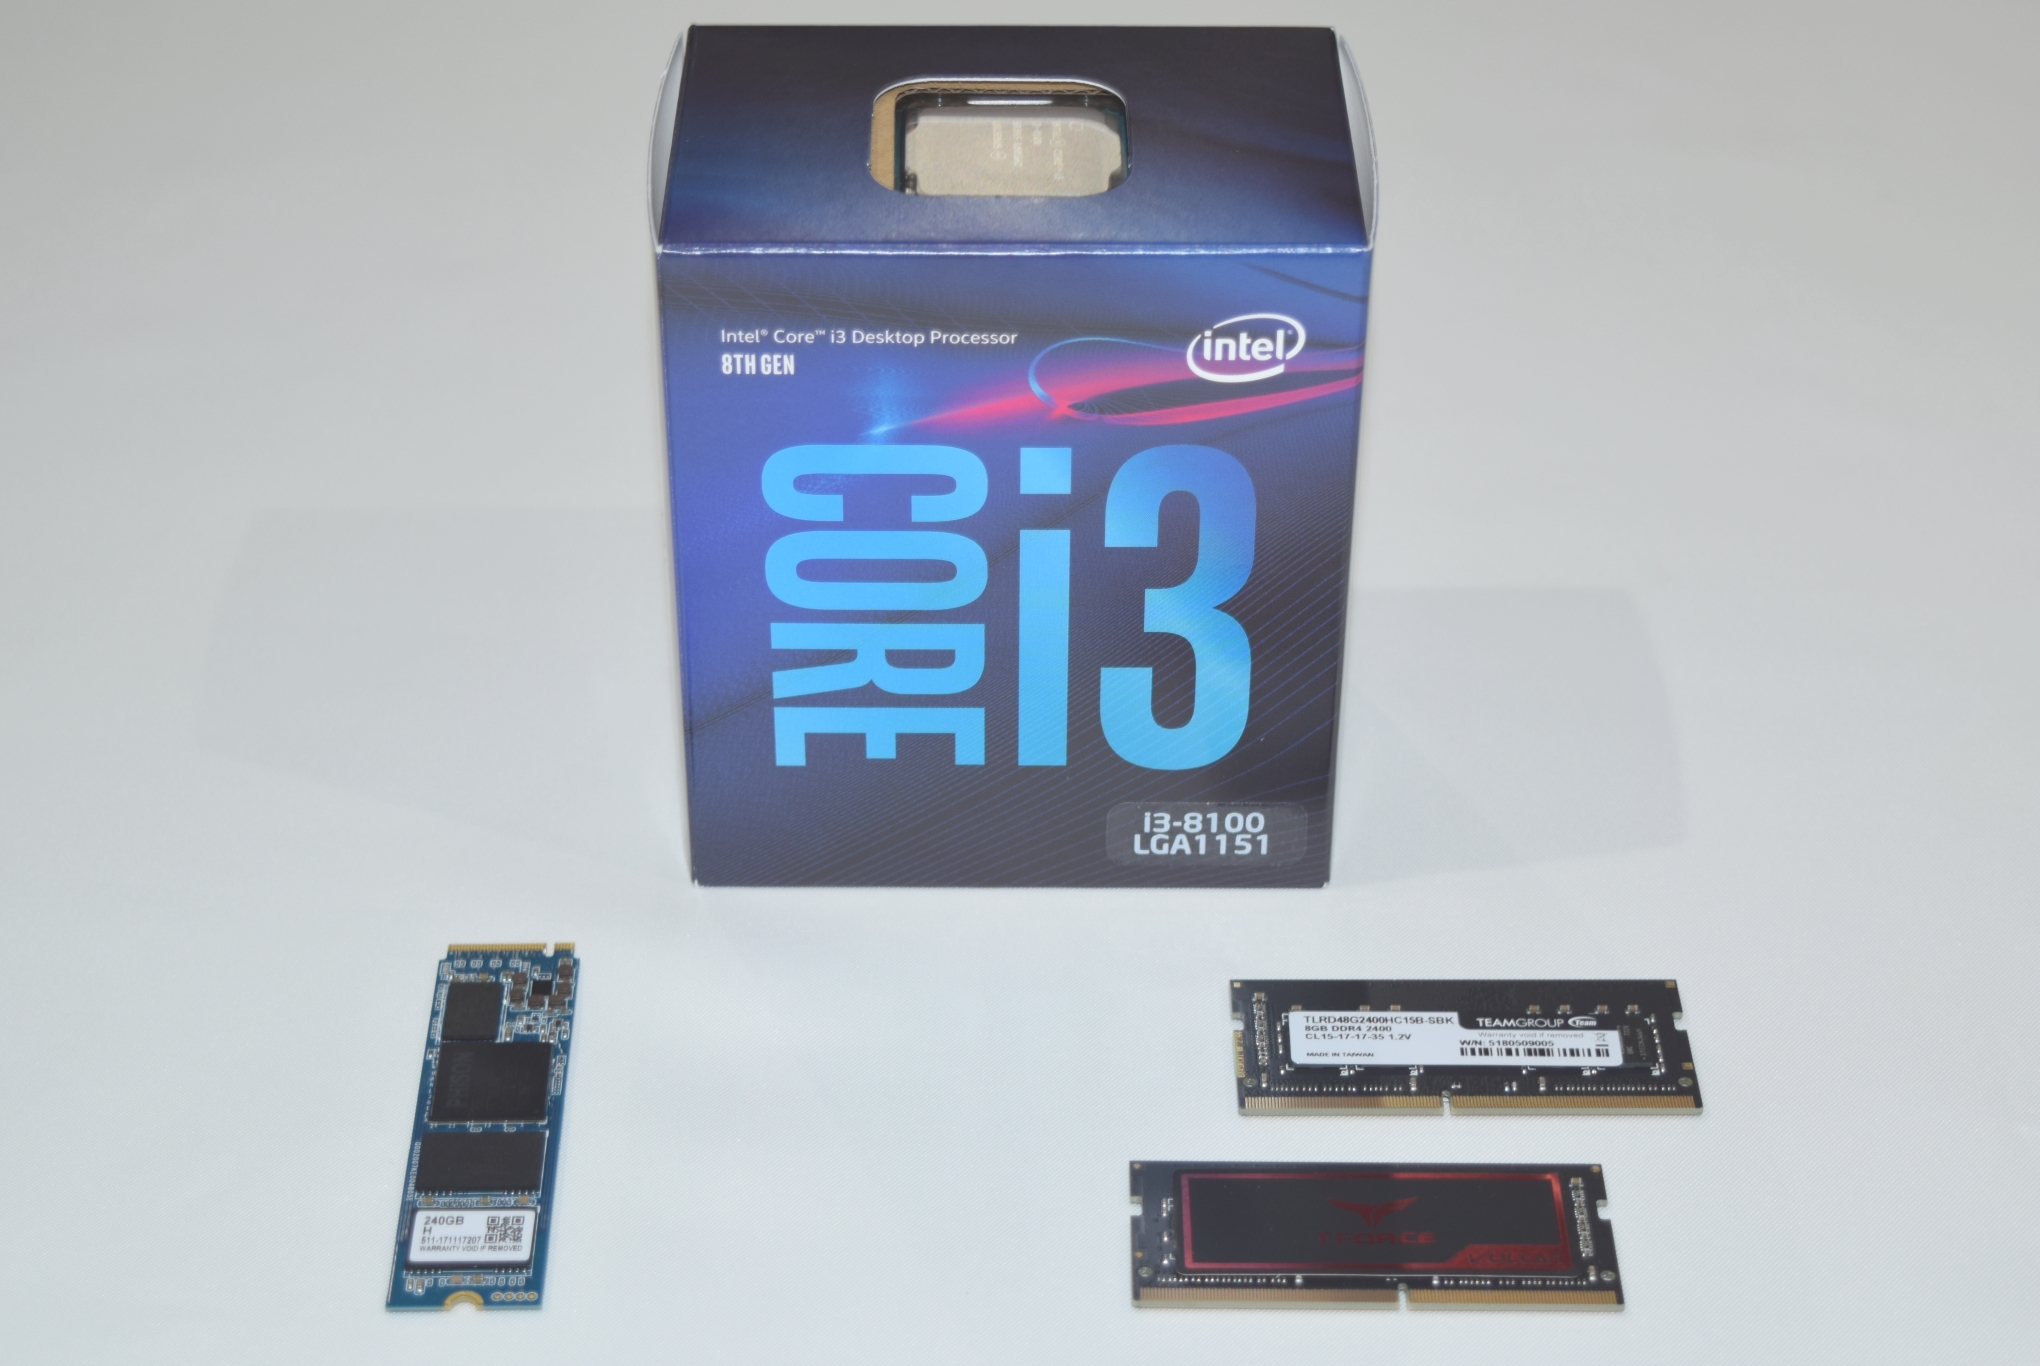
ASRock sampled us a barebones unit of the DeskMini 310. In order to complete the build, Intel helped us out with a Core i3-8100 (the budget H310-chipset is usually paired with one of the compatible low-end Core-series or Pentium/Celeron processors). We used a 240GB Phison PS5007 reference design with MLC flash for the NVMe drive (roughly equivalent to the Corsair FORCE MP500 or the Kingston KC1000) and Team Group's Vulcan DDR4 SODIMMs rated for 2400 MHz operation.
The specifications of our ASRock DeskMini 310 review configuration are summarized in the table below.
| ASRock DeskMini 310 Specifications | |
| Processor | Intel Core i3-8100 8th Gen. (Coffee Lake), 4C/4T, 3.6 GHz, 14nm++, 6MB, 65W TDP |
| Memory | Team Group TEAMGROUP-SD4-2400 DDR4 SODIMM 16-16-16-39 @ 2400 MHz 2x8 GB |
| Graphics | Intel UHD Graphics 630 |
| Disk Drive(s) | TEKQ PSE7 NVMe (comparable to Corsair FORCE MP500) (240 GB; M.2 2280 PCIe 3.0 x4; Toshiba 15nm MLC) |
| Networking | Intel Dual Band Wireless-AC 3168 (1x1 802.11ac - 433 Mbps) -Intel I219V Gigabit Ethernet Controller |
| Audio | 3.5mm Headphone Jack Capable of 5.1/7.1 digital output with HD audio bitstreaming (HDMI) |
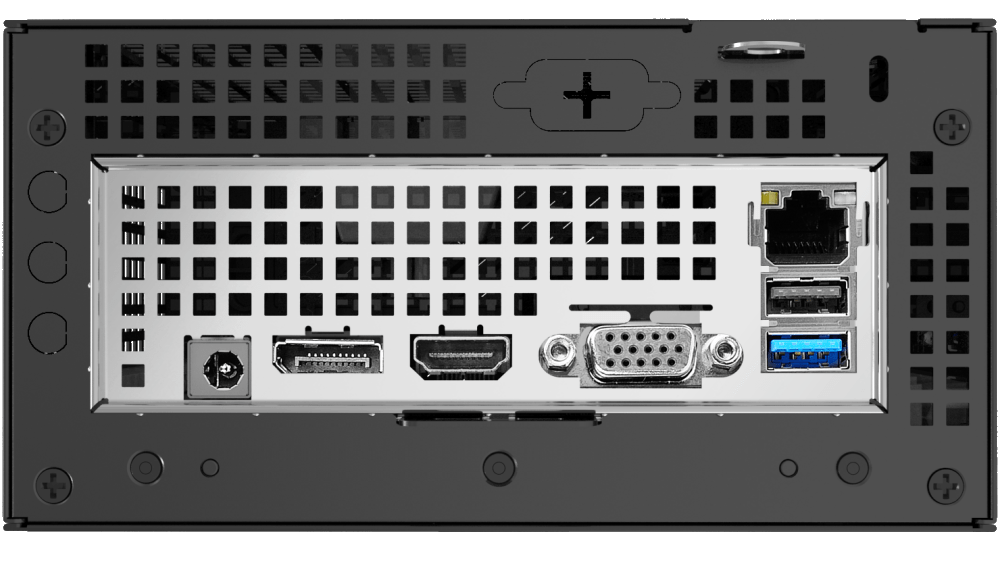
| Miscellaneous I/O Ports | 3x USB 2.0 2x USB 3.0 Type-A, 1x USB 3.1 Gen 1 Type-C 1x micro-SDXC |
| Operating System | Retail unit is barebones, but we installed Windows 10 Enterprise x64 |
| Pricing (As configured) | $162 (barebones) $523 (as configured, No OS) |
| Full Specifications | ASRock DeskMini 310 Specifications |
In the table below, we have an overview of the various systems that we are comparing the ASRock DeskMini 310 against. Note that they may not belong to the same market segment. The relevant configuration details of the machines are provided so that readers have an understanding of why some benchmark numbers are skewed for or against the ASRock DeskMini 310 when we come to those sections.
| Comparative PC Configurations | ||
| Aspect | ASRock DeskMini 310 | |
| CPU | Intel Core i3-8100 | Intel Core i3-8100 |
| GPU | Intel UHD Graphics 630 | Intel UHD Graphics 630 |
| RAM | Team Group TEAMGROUP-SD4-2400 DDR4 SODIMM 16-16-16-39 @ 2400 MHz 2x8 GB |
Team Group TEAMGROUP-SD4-2400 DDR4 SODIMM 16-16-16-39 @ 2400 MHz 2x8 GB |
| Storage | TEKQ PSE7 NVMe (comparable to Corsair FORCE MP500) (240 GB; M.2 2280 PCIe 3.0 x4; Toshiba 15nm MLC) |
TEKQ PSE7 NVMe (comparable to Corsair FORCE MP500) (240 GB; M.2 2280 PCIe 3.0 x4; Toshiba 15nm MLC) |
| Wi-Fi | Intel Dual Band Wireless-AC 3168 (1x1 802.11ac - 433 Mbps) |
Intel Dual Band Wireless-AC 3168 (1x1 802.11ac - 433 Mbps) |
| Price (in USD, when built) | $162 (barebones) $523 (as configured, No OS) |
$162 (barebones) $523 (as configured, No OS) |
BAPCo SYSmark 2018
The ASRock DeskMini 310 was evaluated using our Fall 2018 test suite for small-form factor PCs. In the first section, we will be looking at SYSmark 2018.
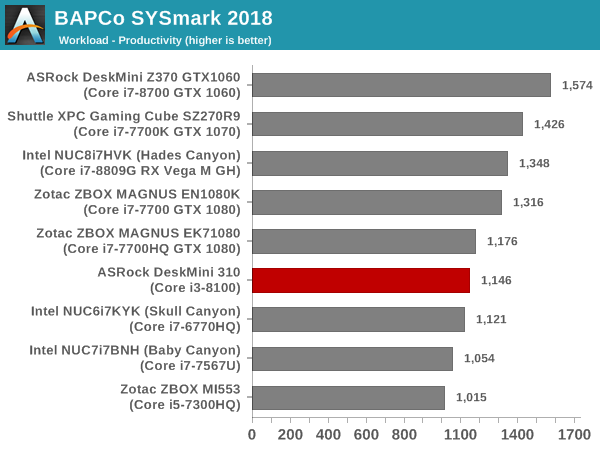
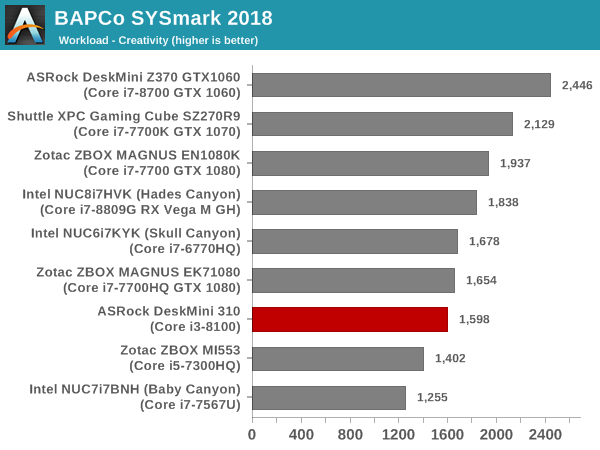
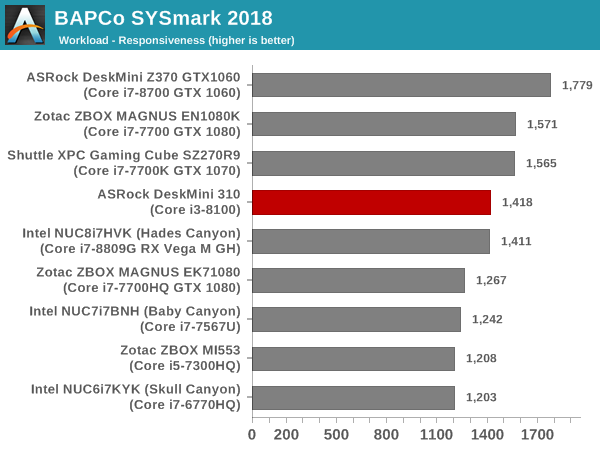
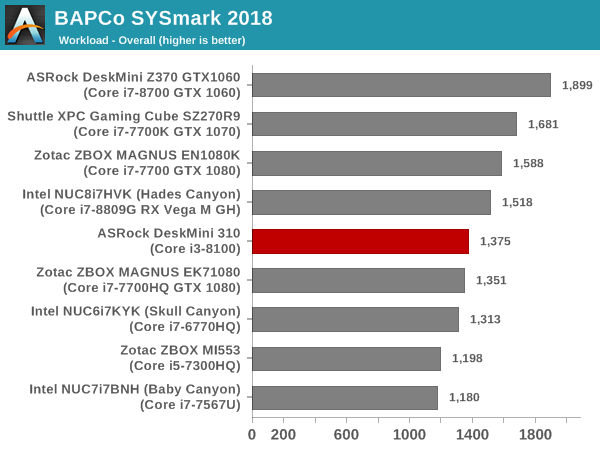
BAPCo's SYSmark 2018 is an application-based benchmark that uses real-world applications to replay usage patterns of business users in the areas of productivity, creativity, and responsiveness. The 'Productivity Scenario' covers office-centric activities including word processing, spreadsheet usage, financial analysis, software development, application installation, file compression, and e-mail management. The 'Creativity Scenario' represents media-centric activities such as digital photo processing, AI and ML for face recognition in photos and videos for the purpose of content creation, etc. The 'Responsiveness Scenario' evaluates the ability of the system to react in a quick manner to user inputs in areas such as application and file launches, web browsing, and multi-tasking.
Scores are meant to be compared against a reference desktop (the SYSmark 2018 calibration system, a Dell Optiplex 5050 tower with a Core i3-7100 and 4GB of DDR4-2133 memory to go with a 128GB M.2 SATA III SSD). The calibration system scores 1000 in each of the scenarios. A score of, say, 2000, would imply that the system under test is twice as fast as the reference system.
SYSmark 2018 also adds energy measurement to the mix. A high score in the SYSmark benchmarks might be nice to have, but, potential customers also need to determine the balance between power consumption and the efficiency of the system. For example, in the average office scenario, it might not be worth purchasing a noisy and power-hungry PC just because it ends up with a 2000 score in the SYSmark 2014 SE benchmarks. In order to provide a balanced perspective, SYSmark 2018 also allows vendors and decision makers to track the energy consumption during each workload. In the graphs below, we find the total energy consumed by the PC under test for a single iteration of each SYSmark 2018 workload. For reference, the calibration system consumes 5.36 Wh for productivity, 7.71 Wh for creativity, 5.61 Wh for responsiveness, and 18.68 Wh overall.
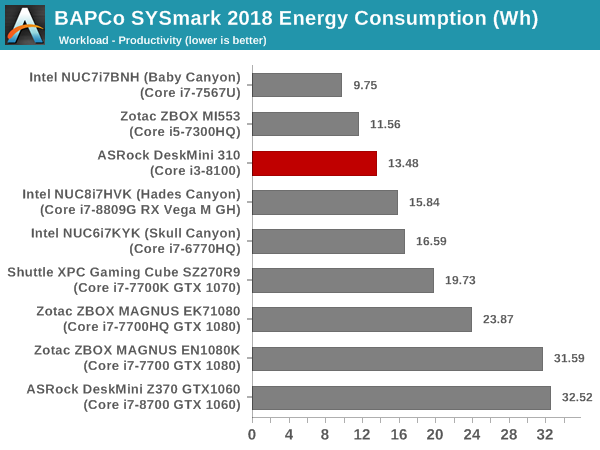
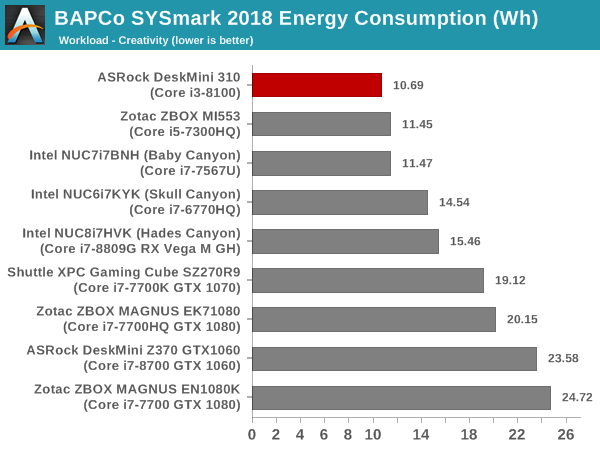
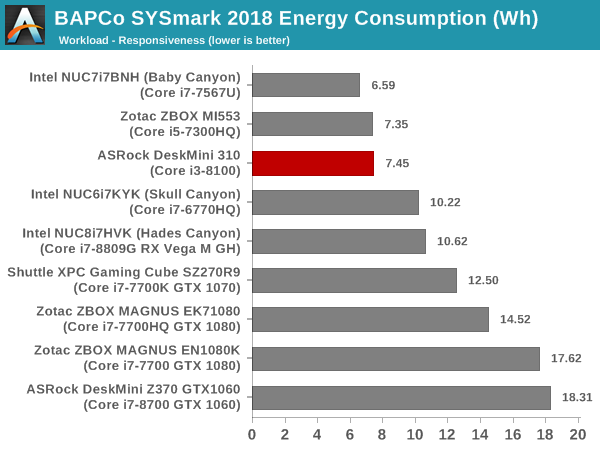
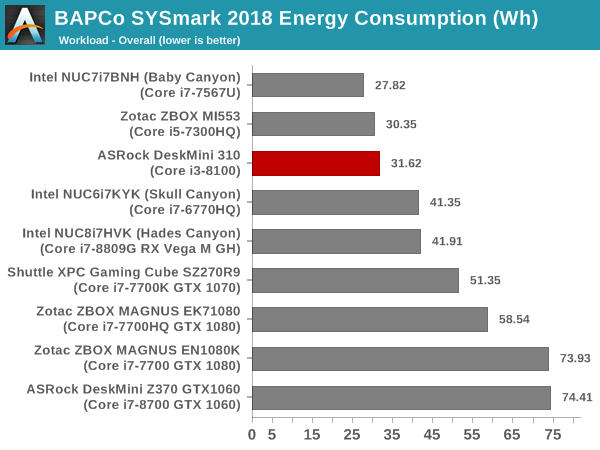
The DeskMini 310 comes in the middle of the pack across all the SYSmark 2018 scenarios. However, in terms of energy consumption, it is in the top half. This bodes well for the DeskMini 310 being an energy-efficient machine for office use.
UL Benchmarks - PCMark and 3DMark
This section deals with a selection of the UL Futuremark benchmarks - PCMark 10, PCMark 8, and 3DMark. While the first two evaluate the system as a whole, 3DMark focuses on the graphics capabilities.
PCMark 10
UL's PCMark 10 evaluates computing systems for various usage scenarios (generic / essential tasks such as web browsing and starting up applications, productivity tasks such as editing spreadsheets and documents, gaming, and digital content creation). We benchmarked select PCs with the PCMark 10 Extended profile and recorded the scores for various scenarios. These scores are heavily influenced by the CPU and GPU in the system, though the RAM and storage device also play a part. The power plan was set to Balanced for all the PCs while processing the PCMark 10 benchmark.
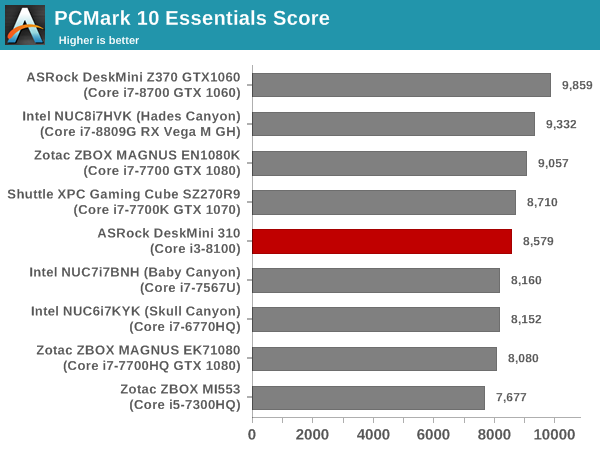
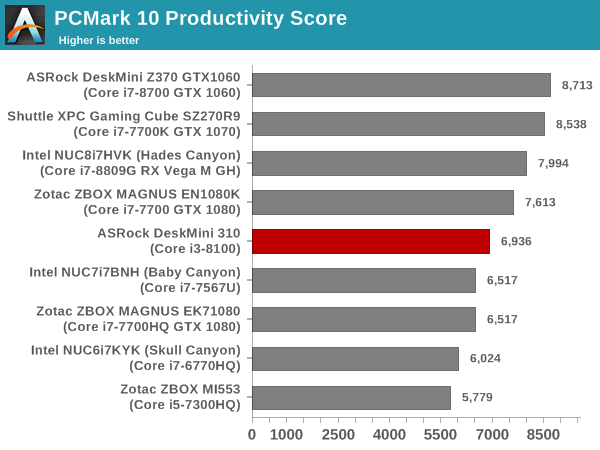
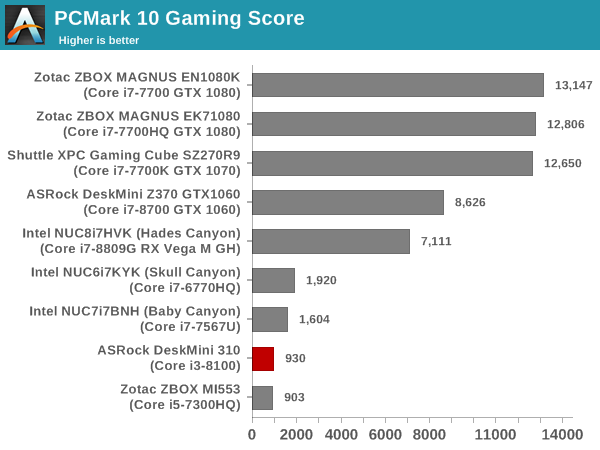
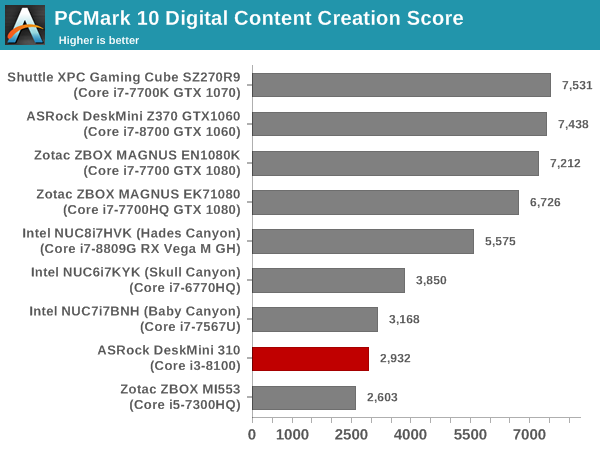

The DeskMini 310 is in the middle of the pack for the Essentials and Productivity workloads. We already know that the gaming workloads are a weak point for the integrated GPUs in the low-end Core series desktop CPUs. Therefore, the relative positions in the other workloads are not surprising
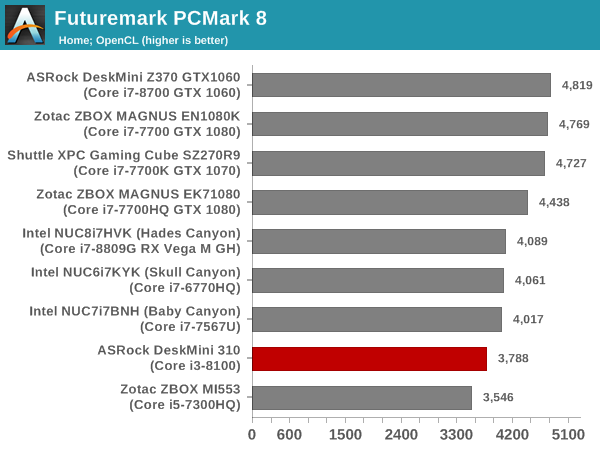
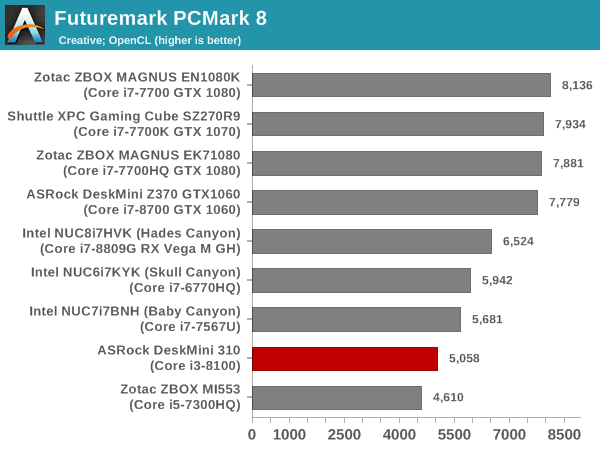
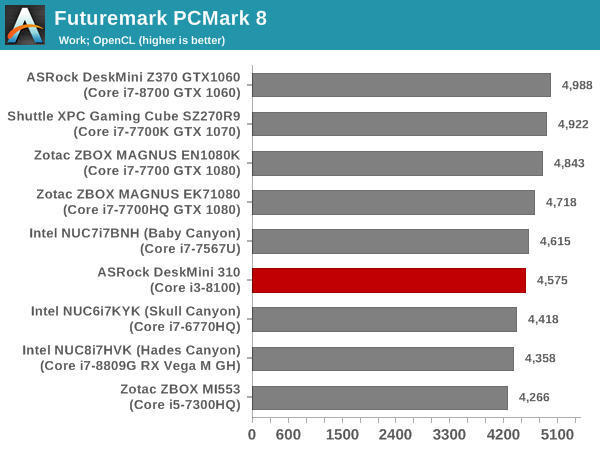
PCMark 8
We continue to present PCMark 8 benchmark results (as those have more comparison points) while our PCMark 10 scores database for systems grows in size. PCMark 8 provides various usage scenarios (home, creative and work) and offers ways to benchmark both baseline (CPU-only) as well as OpenCL accelerated (CPU + GPU) performance. We benchmarked select PCs for the OpenCL accelerated performance in all three usage scenarios. These scores are heavily influenced by the CPU in the system. As expected, the DeskMini 310 comes in the middle in the Work scenario. Homw and Creative workloads don't seem to strongpoints for the system.
3DMark
UL's 3DMark comes with a diverse set of graphics workloads that target different Direct3D feature levels. Correspondingly, the rendering resolutions are also different. We use 3DMark 2.4.4264 to get an idea of the graphics capabilities of the system. In this section, we take a look at the performance of the ASRock DeskMini 310 across the different 3DMark workloads.
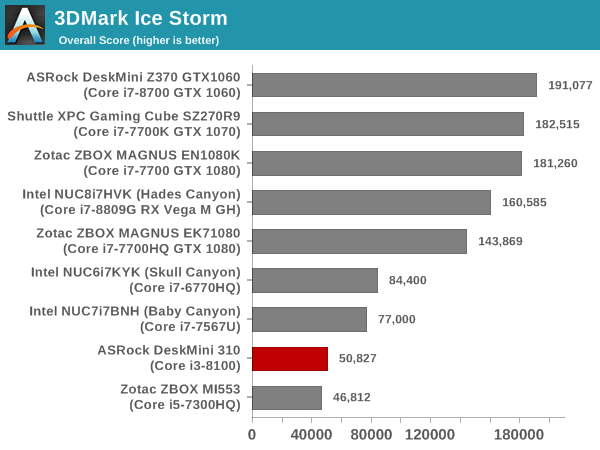
3DMark Ice Storm
This workload has three levels of varying complexity - the vanilla Ice Storm, Ice Storm Unlimited, and Ice Storm Extreme. It is a cross-platform benchmark (which means that the scores can be compared across different tablets and smartphones as well). All three use DirectX 11 (feature level 9) / OpenGL ES 2.0. While the Extreme renders at 1920 x 1080, the other two render at 1280 x 720. The graphs below present the various Ice Storm worloads' numbers for different systems that we have evaluated.
| UL 3DMark - Ice Storm Workloads | |||
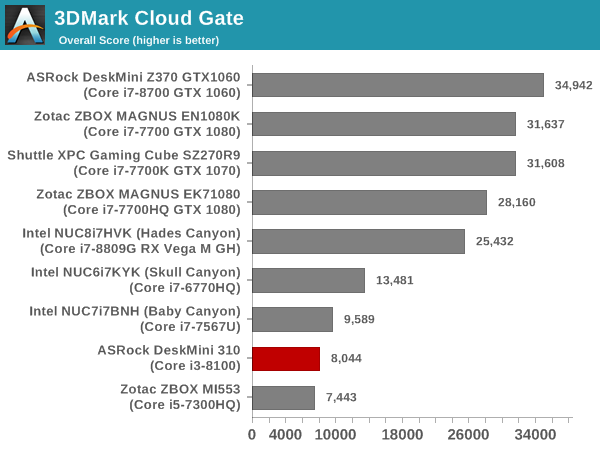
3DMark Cloud Gate
The Cloud Gate workload is meant for notebooks and typical home PCs, and uses DirectX 11 (feature level 10) to render frames at 1280 x 720. The graph below presents the overall score for the workload across all the systems that are being compared.
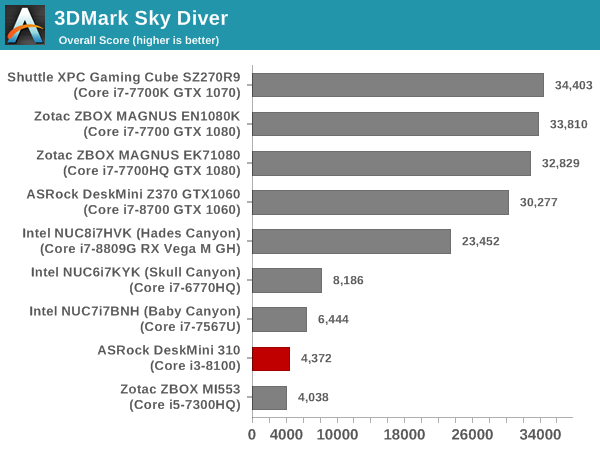
3DMark Sky Diver
The Sky Diver workload is meant for gaming notebooks and mid-range PCs, and uses DirectX 11 (feature level 11) to render frames at 1920 x 1080. The graph below presents the overall score for the workload across all the systems that are being compared.
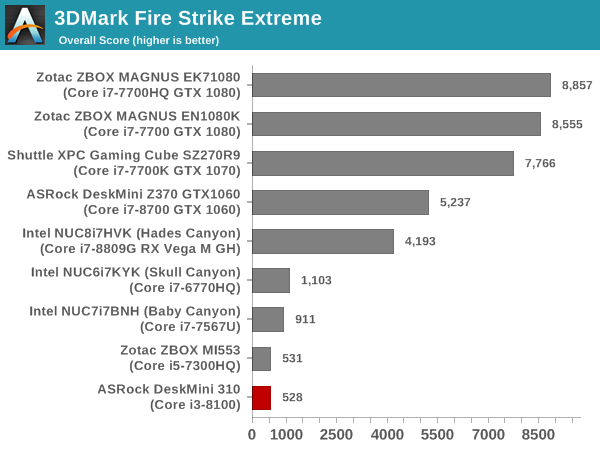
3DMark Fire Strike Extreme
The Fire Strike benchmark has three workloads. The base version is meant for high-performance gaming PCs. Similar to Sky Diver, it uses DirectX 11 (feature level 11) to render frames at 1920 x 1080. The Ultra version targets 4K gaming system, and renders at 3840 x 2160. However, we only deal with the Extreme version in our benchmarking - It renders at 2560 x 1440, and targets multi-GPU systems and overclocked PCs. The graph below presents the overall score for the Fire Strike Extreme benchmark across all the systems that are being compared.
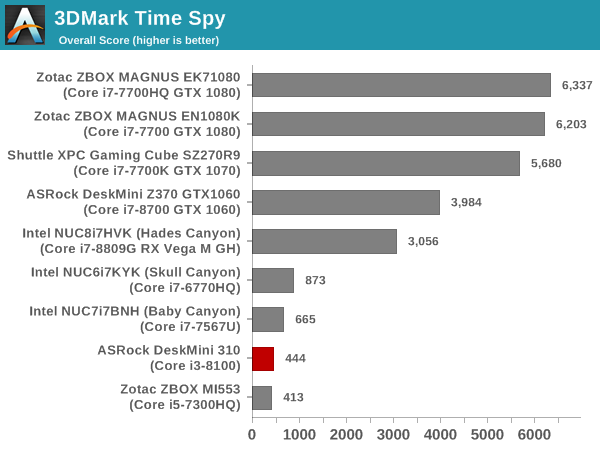
3DMark Time Spy
The Time Spy workload has two levels with different complexities. Both use DirectX 12 (feature level 11). However, the plain version targets high-performance gaming PCs with a 2560 x 1440 render resolution, while the Extreme version renders at 3840 x 2160 resolution. The graphs below present both numbers for all the systems that are being compared in this review.
| UL 3DMark - Time Spy Workloads | |||
3DMark Night Raid
The Night Raid workload is a DirectX 12 benchmark test. It is less demanding than Time Spy, and is optimized for integrated graphics. The graph below presents the overall score in this workload for different system configurations.
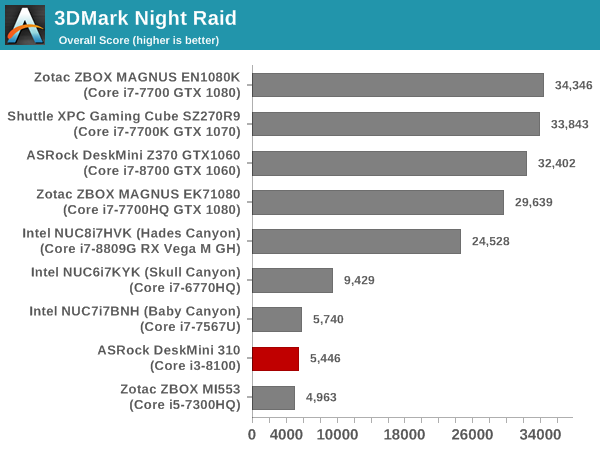
As expected, the gaming prowess of the Core i3-8100 in the DeskMini 310 is nothing to write home about. It comes in second from last across all the workloads, turning out to be only slightly better than the Zotac ZBOX MI553 (using the Core i5-7300HQ).
Miscellaneous Performance Metrics
This section looks at some of the other commonly used benchmarks representative of the performance of specific real-world applications.
3D Rendering - CINEBENCH R15
Our SFF PC reviews use CINEBENCH R15 for 3D rendering evaluation. The program provides three benchmark modes - OpenGL, single threaded and multi-threaded. Evaluation of different PC configurations in all three modes provided us the following results.
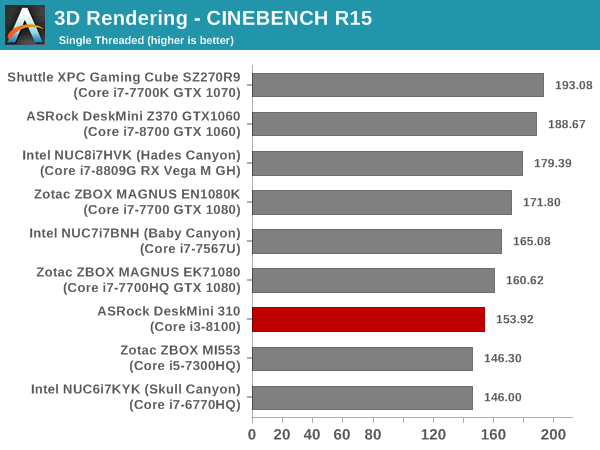
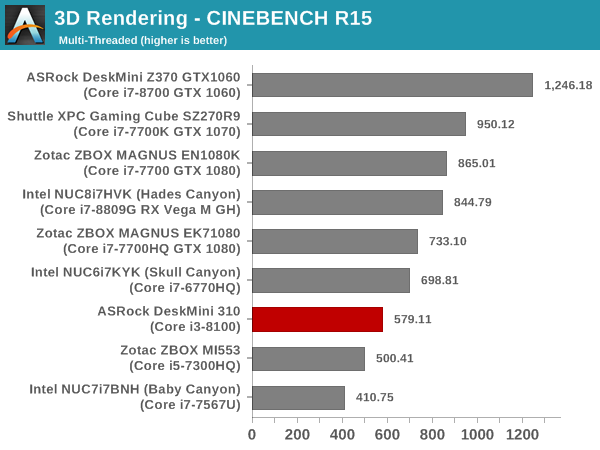
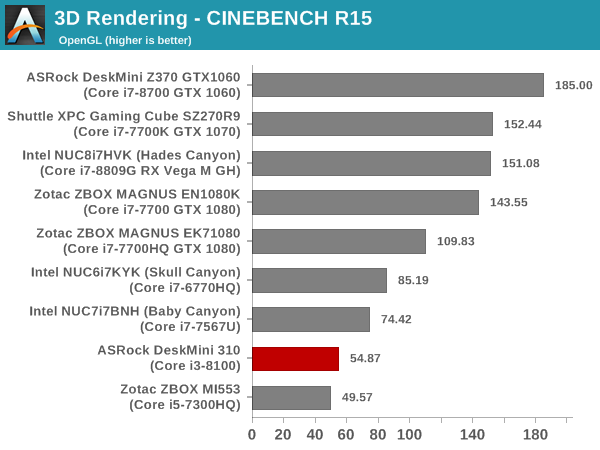
The TDP of the Core i3-8100 allows the DeskMini 310 to come out with better single-threaded performance compared to the Skull Canyon NUC, but loses out in the multi-threading case due to the absence of hyperthreading.
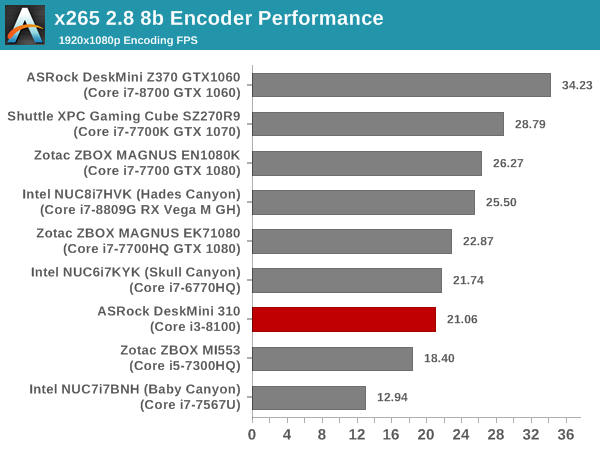
x265 Benchmark
Next up, we have some video encoding benchmarks using x265 v2.8. The appropriate encoder executable is chosen based on the supported CPU features. In the first case, we encode 600 1080p YUV 4:2:0 frames into a 1080p30 HEVC Main-profile compatible video stream at 1 Mbps and record the average number of frames encoded per second.
Our second test case is 1200 4K YUV 4:2:0 frames getting encoded into a 4Kp60 HEVC Main10-profile video stream at 35 Mbps. The encoding FPS is recorded.
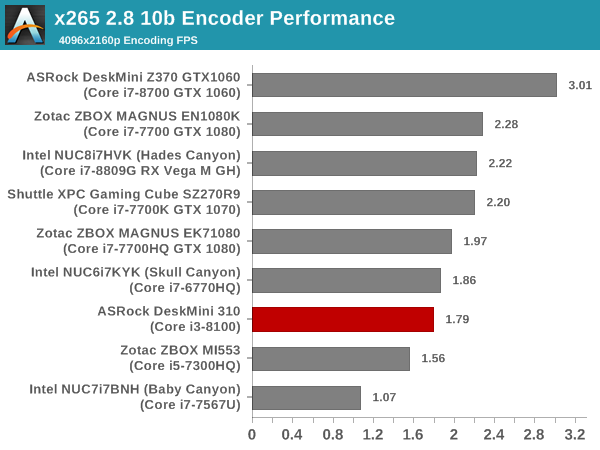
Performance with x265 is very similar to the other workloads we have considered so far. The DeskMini 310 / Core i3-8100 is better than the Zotact ZBOX MI553 / Core i5-7300HQ, but, other systems with Core i7 CPUs almost always perform better.
7-Zip
7-Zip is a very effective and efficient compression program, often beating out OpenCL accelerated commercial programs in benchmarks even while using just the CPU power. 7-Zip has a benchmarking program that provides tons of details regarding the underlying CPU's efficiency. In this subsection, we are interested in the compression and decompression rates when utilizing all the available threads for the LZMA algorithm.
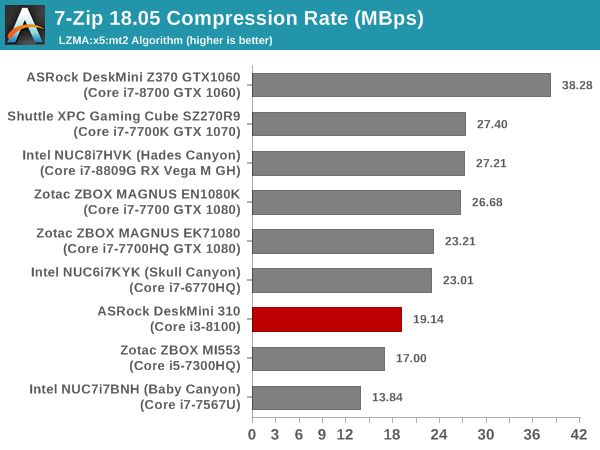
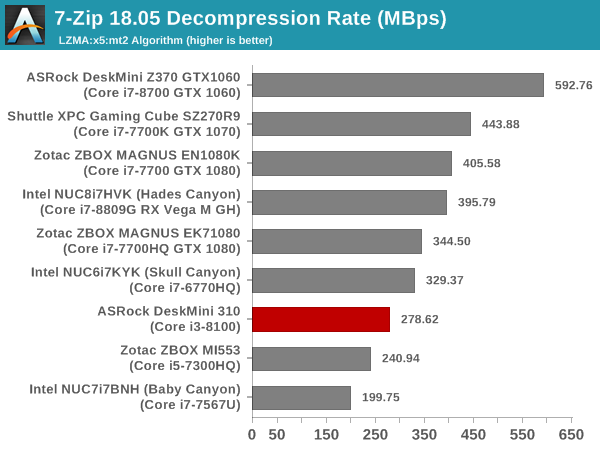
The scenario seen in the x265 benchmark is seen in the 7-Zip case also.
Cryptography Benchmarks
Cryptography has become an indispensable part of our interaction with computing systems. Almost all modern systems have some sort of hardware-acceleration for making cryptographic operations faster and more power efficient. In this sub-section, we look at two different real-world applications that may make use of this acceleration.
BitLocker is a Windows features that encrypts entire disk volumes. While drives that offer encryption capabilities are dealt with using that feature, most legacy systems and external drives have to use the host system implementation. Windows has no direct benchmark for BitLocker. However, we cooked up a BitLocker operation sequence to determine the adeptness of the system at handling BitLocker operations. We start off with a 2.5GB RAM drive in which a 2GB VHD (virtual hard disk) is created. This VHD is then mounted, and BitLocker is enabled on the volume. Once the BitLocker encryption process gets done, BitLocker is disabled. This triggers a decryption process. The times taken to complete the encryption and decryption are recorded. This process is repeated 25 times, and the average of the last 20 iterations is graphed below.
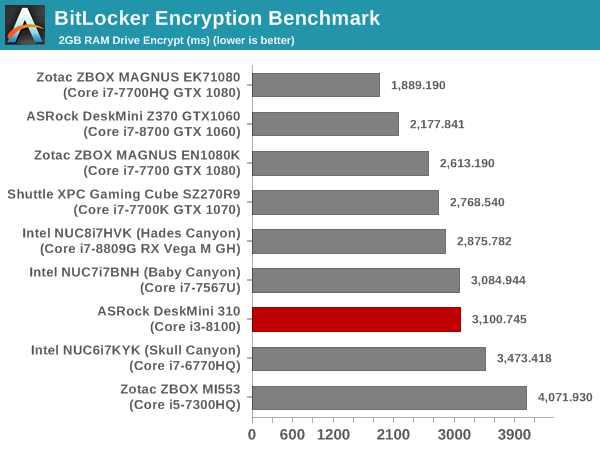
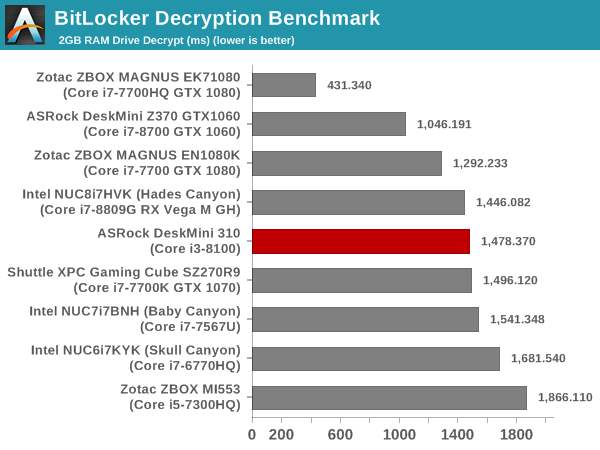
The clocks of the Core i3-8100 help the DeskMini 310 appear in the middle of the pack in the cryptography benchmarks.
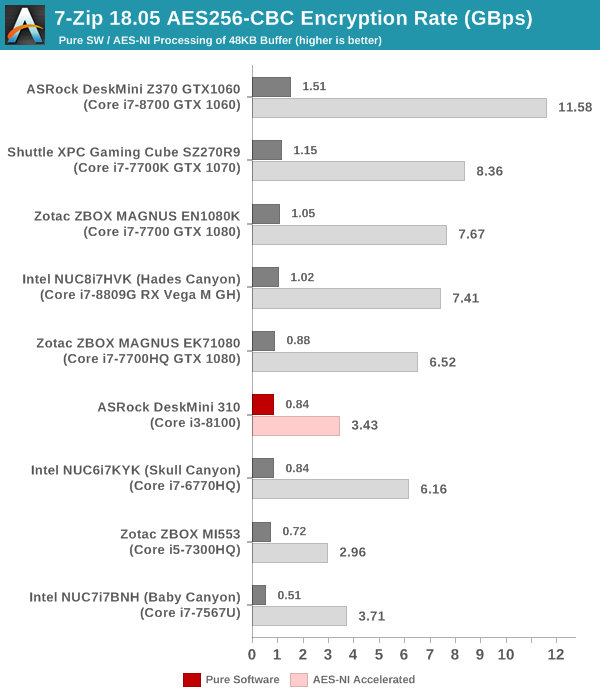
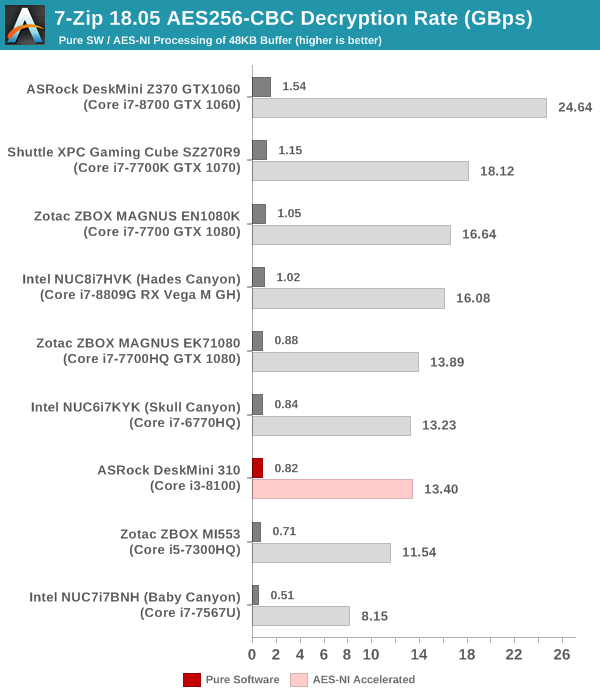
Creation of secure archives is best done through the use of AES-256 as the encryption method while password protecting ZIP files. We re-use the benchmark mode of 7-Zip to determine the AES256-CBC encryption and decryption rates using pure software as well as AES-NI. Note that the 7-Zip benchmark uses a 48KB buffer for this purpose.
Yet another cryptography application is secure network communication. OpenSSL can take advantage of the acceleration provided by the host system to make operations faster. It also has a benchmark mode that can use varying buffer sizes. We recorded the processing rate for a 8KB buffer using the hardware-accelerated AES256-CBC-HAC-SHA1 feature.
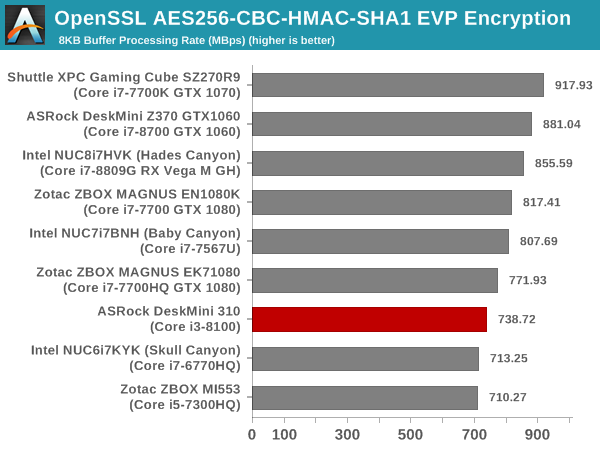
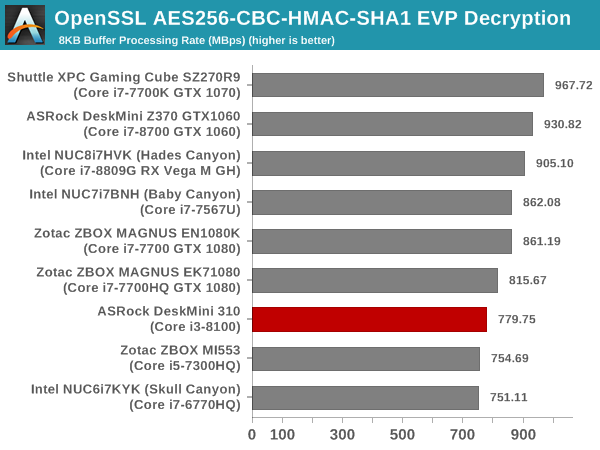
We see the same relative positions across all the cryptography benchmarks, with the DeskMini 310 managing to consistently surpass only the Zotac ZBOX MI553.
Agisoft Photoscan
Agisoft PhotoScan is a commercial program that converts 2D images into 3D point maps, meshes and textures. The program designers sent us a command line version in order to evaluate the efficiency of various systems that go under our review scanner. The command line version has two benchmark modes, one using the CPU and the other using both the CPU and GPU (via OpenCL). We present the results from our evaluation using the CPU mode only. The benchmark (v1.3) takes 84 photographs and does four stages of computation:
- Stage 1: Align Photographs (capable of OpenCL acceleration)
- Stage 2: Build Point Cloud (capable of OpenCL acceleration)
- Stage 3: Build Mesh
- Stage 4: Build Textures
We record the time taken for each stage. Since various elements of the software are single threaded, and others multithreaded, it is interesting to record the effects of CPU generations, speeds, number of cores, and DRAM parameters using this software.
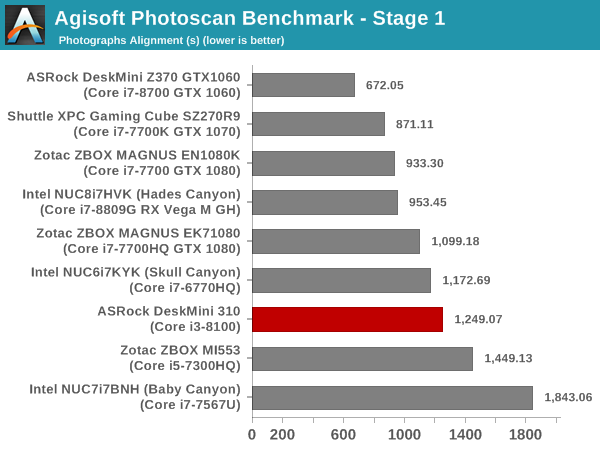
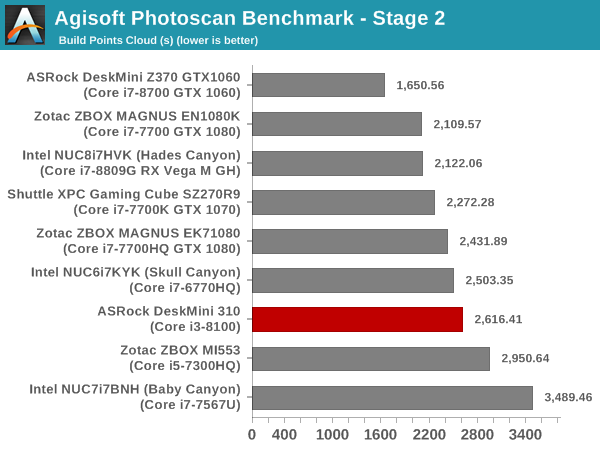
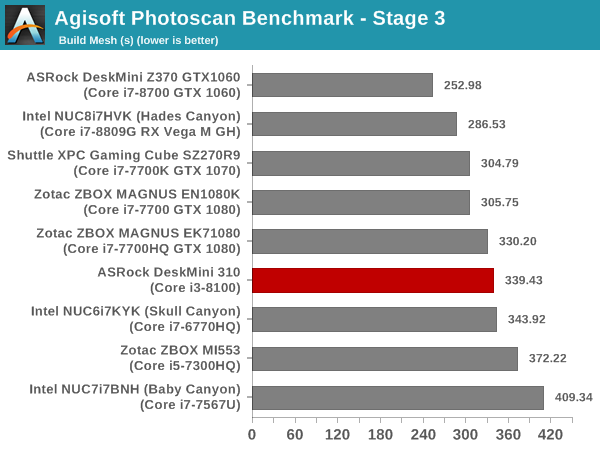
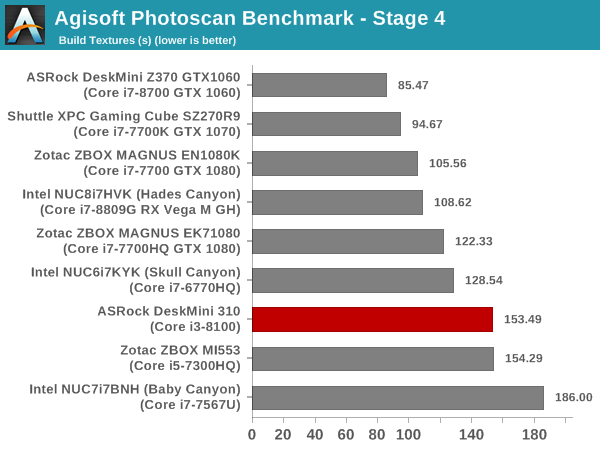
Here, we see the same relative behavior of the Core i3-8100 being unable to consistently surpass PCs with CPUs other than the Core i5-7300HQ.
Dolphin Emulator
Wrapping up our application benchmark numbers is the new Dolphin Emulator (v5) benchmark mode results. This is again a test of the CPU capabilities/
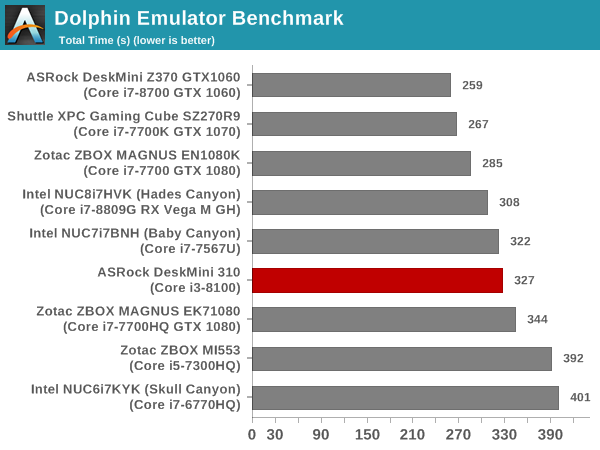
The DeskMini 310 moves to the middle of the set in this emulator benchmark.
Networking and Storage Performance
Networking and storage are two major aspects which influence our experience with any computing system. This section presents results from our evaluation of these aspects in the ASRock DeskMini 310. On the storage side, one option would be repetition of our strenuous SSD review tests on the drive(s) in the PC. Fortunately, to avoid that overkill, PCMark 8 has a storage bench where certain common workloads such as loading games and document processing are replayed on the target drive. Results are presented in two forms, one being a benchmark number and the other, a bandwidth figure. We ran the PCMark 8 storage bench on selected PCs and the results are presented below.
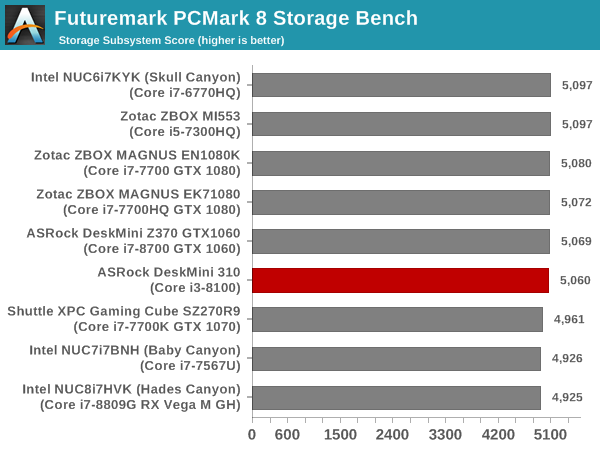
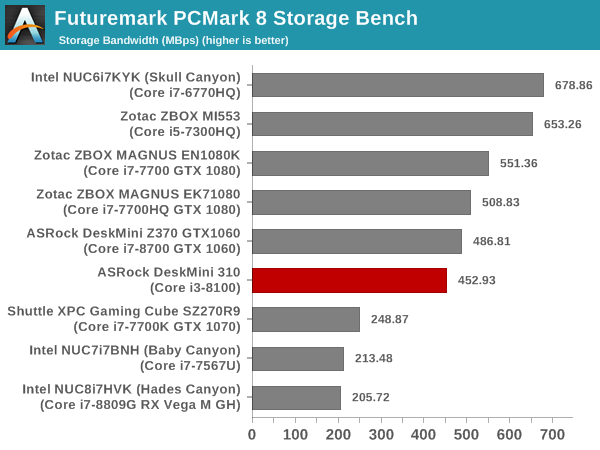
The NVMe SSD used in the DeskMini 310 allows it to be clear of the SATA-using PCs in the above graphs. However, the 240 GB capacity point and general performance prevent the drive from moving up the graph.
On the networking side, we restricted ourselves to the evaluation of the WLAN component. Our standard test router is the Netgear R7000 Nighthawk configured with both 2.4 GHz and 5 GHz networks. The router is placed approximately 20 ft. away, separated by a drywall (as in a typical US building). A wired client is connected to the R7000 and serves as one endpoint for iperf evaluation. The PC under test is made to connect to either the 5 GHz (preferred) or 2.4 GHz SSID and iperf tests are conducted for both TCP and UDP transfers. It is ensured that the PC under test is the only wireless client for the Netgear R7000. We evaluate total throughput for up to 32 simultaneous TCP connections using iperf and present the highest number in the graph below.
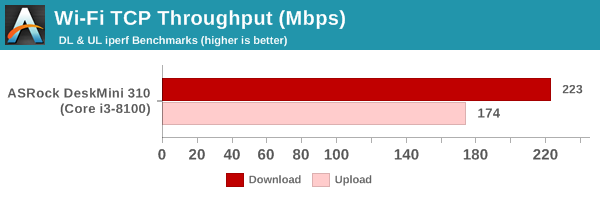
In the UDP case, we try to transfer data at the highest rate possible for which we get less than 1% packet loss.
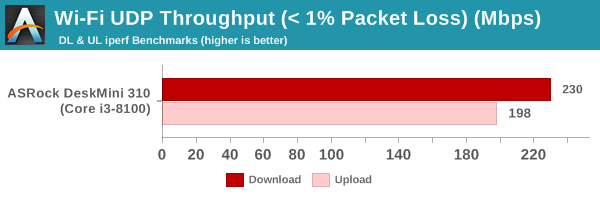
These bandwidth numbers are consistent with what one can expect from a 1x1 client radio.
Power Consumption and Thermal Performance
The power consumption at the wall was measured with a 4K display being driven through the HDMI port. In the graphs below, we compare the idle and load power of the ASRock DeskMini 310 with other low power PCs evaluated before. For load power consumption, we ran the AIDA64 System Stability Test with various stress components, and noted the maximum sustained power consumption at the wall.
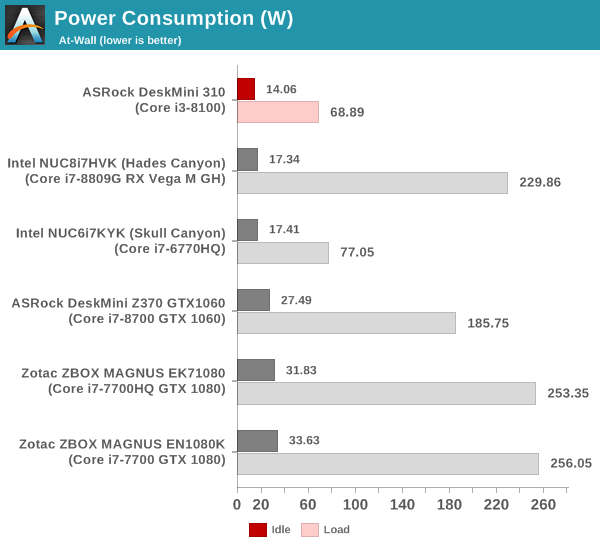
The DeskMini 310 is surprisingly power-efficient despite the presence of a Core i3-8100 65W TDP desktop CPU.
Our thermal stress routine starts with the system at idle, followed by four stages of different system loading profiles using the AIDA64 System Stability Test (each of 30 minutes duration). In the first stage, we stress the CPU, caches and RAM. In the second stage, we add the GPU to the above list. In the third stage, we stress the GPU standalone. In the final stage, we stress all the system components (including the disks). Beyond this, we leave the unit idle in order to determine how quickly the various temperatures in the system can come back to normal idling range. The various clocks, temperatures and power consumption numbers for the system during the above routine are presented in the graphs below.
| ASRock DeskMini 310 System Loading with the AIDA64 System Stability Test | |||
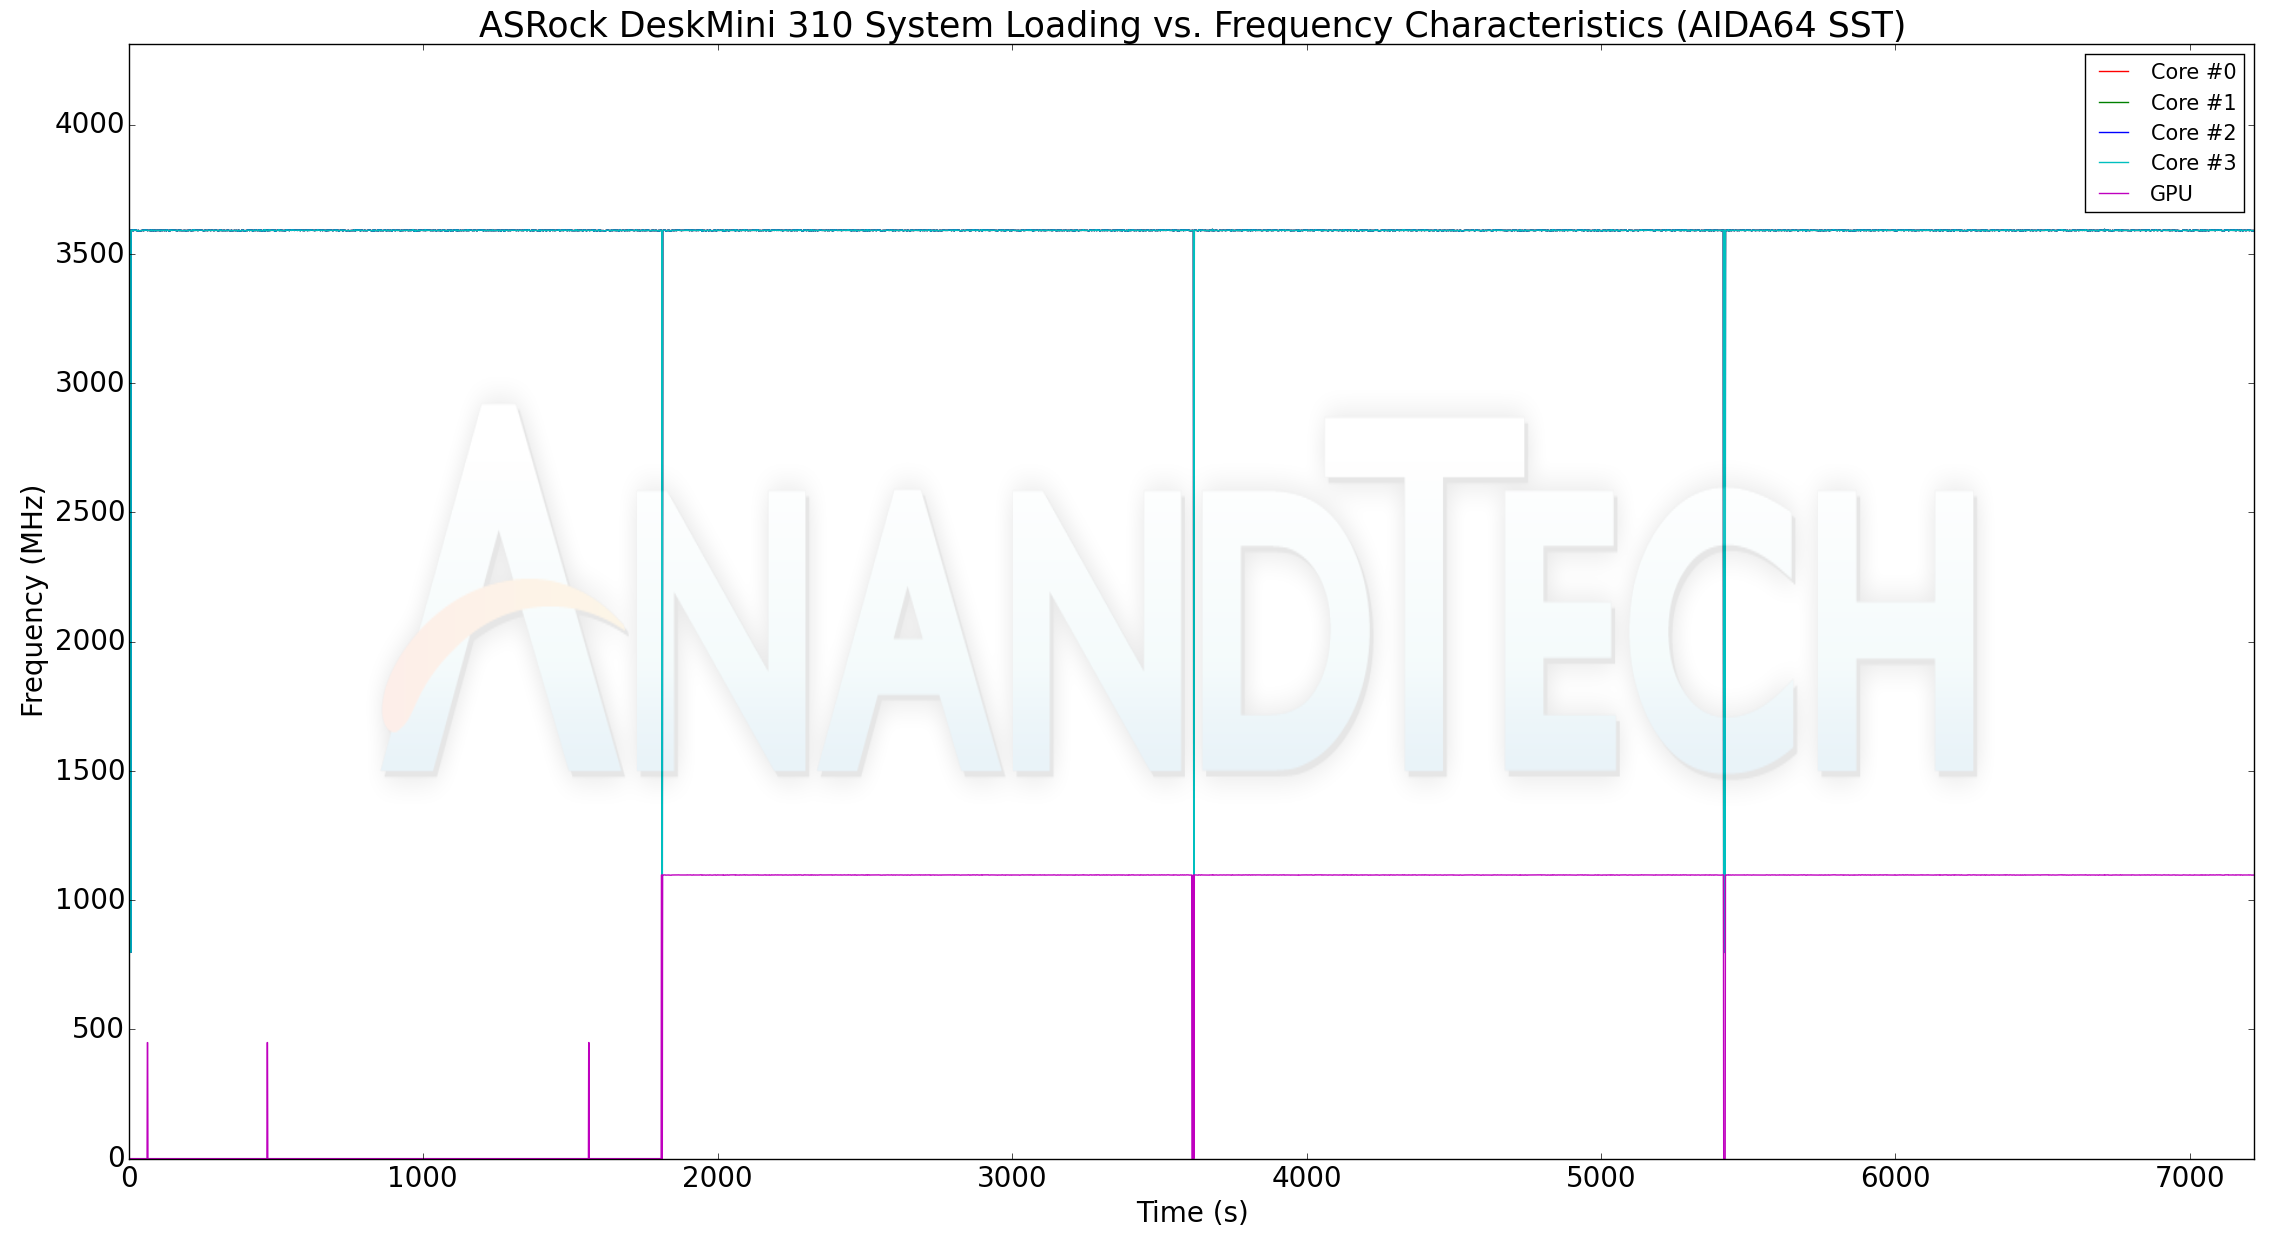
The DeskMini 310 doesn't throttle when subject to the AIDA64 system stability test with stress on various combinations of components. Temperatures stay below 70C and the at-wall power consumption never exceeds 60W. The package power peaks at 35W. As we will see in our custom stress test, the DeskMini 310's BIOS does allow higher power dissipation numbers for the package.
Our custom thermal stress routine starts with the system at idle, followed by 30 minutes of pure CPU loading. This is followed by another 30 minutes of both CPU and GPU being loaded simultaneously. After this, the CPU load gets removed, allowing the GPU to be loaded alone for another 30 minutes. The various clocks and temperatures in the system as well as the power consumption numbers (both internal and at-wall) are presented below.
| ASRock DeskMini 310 System Loading with Prime95 and Furmark | |||
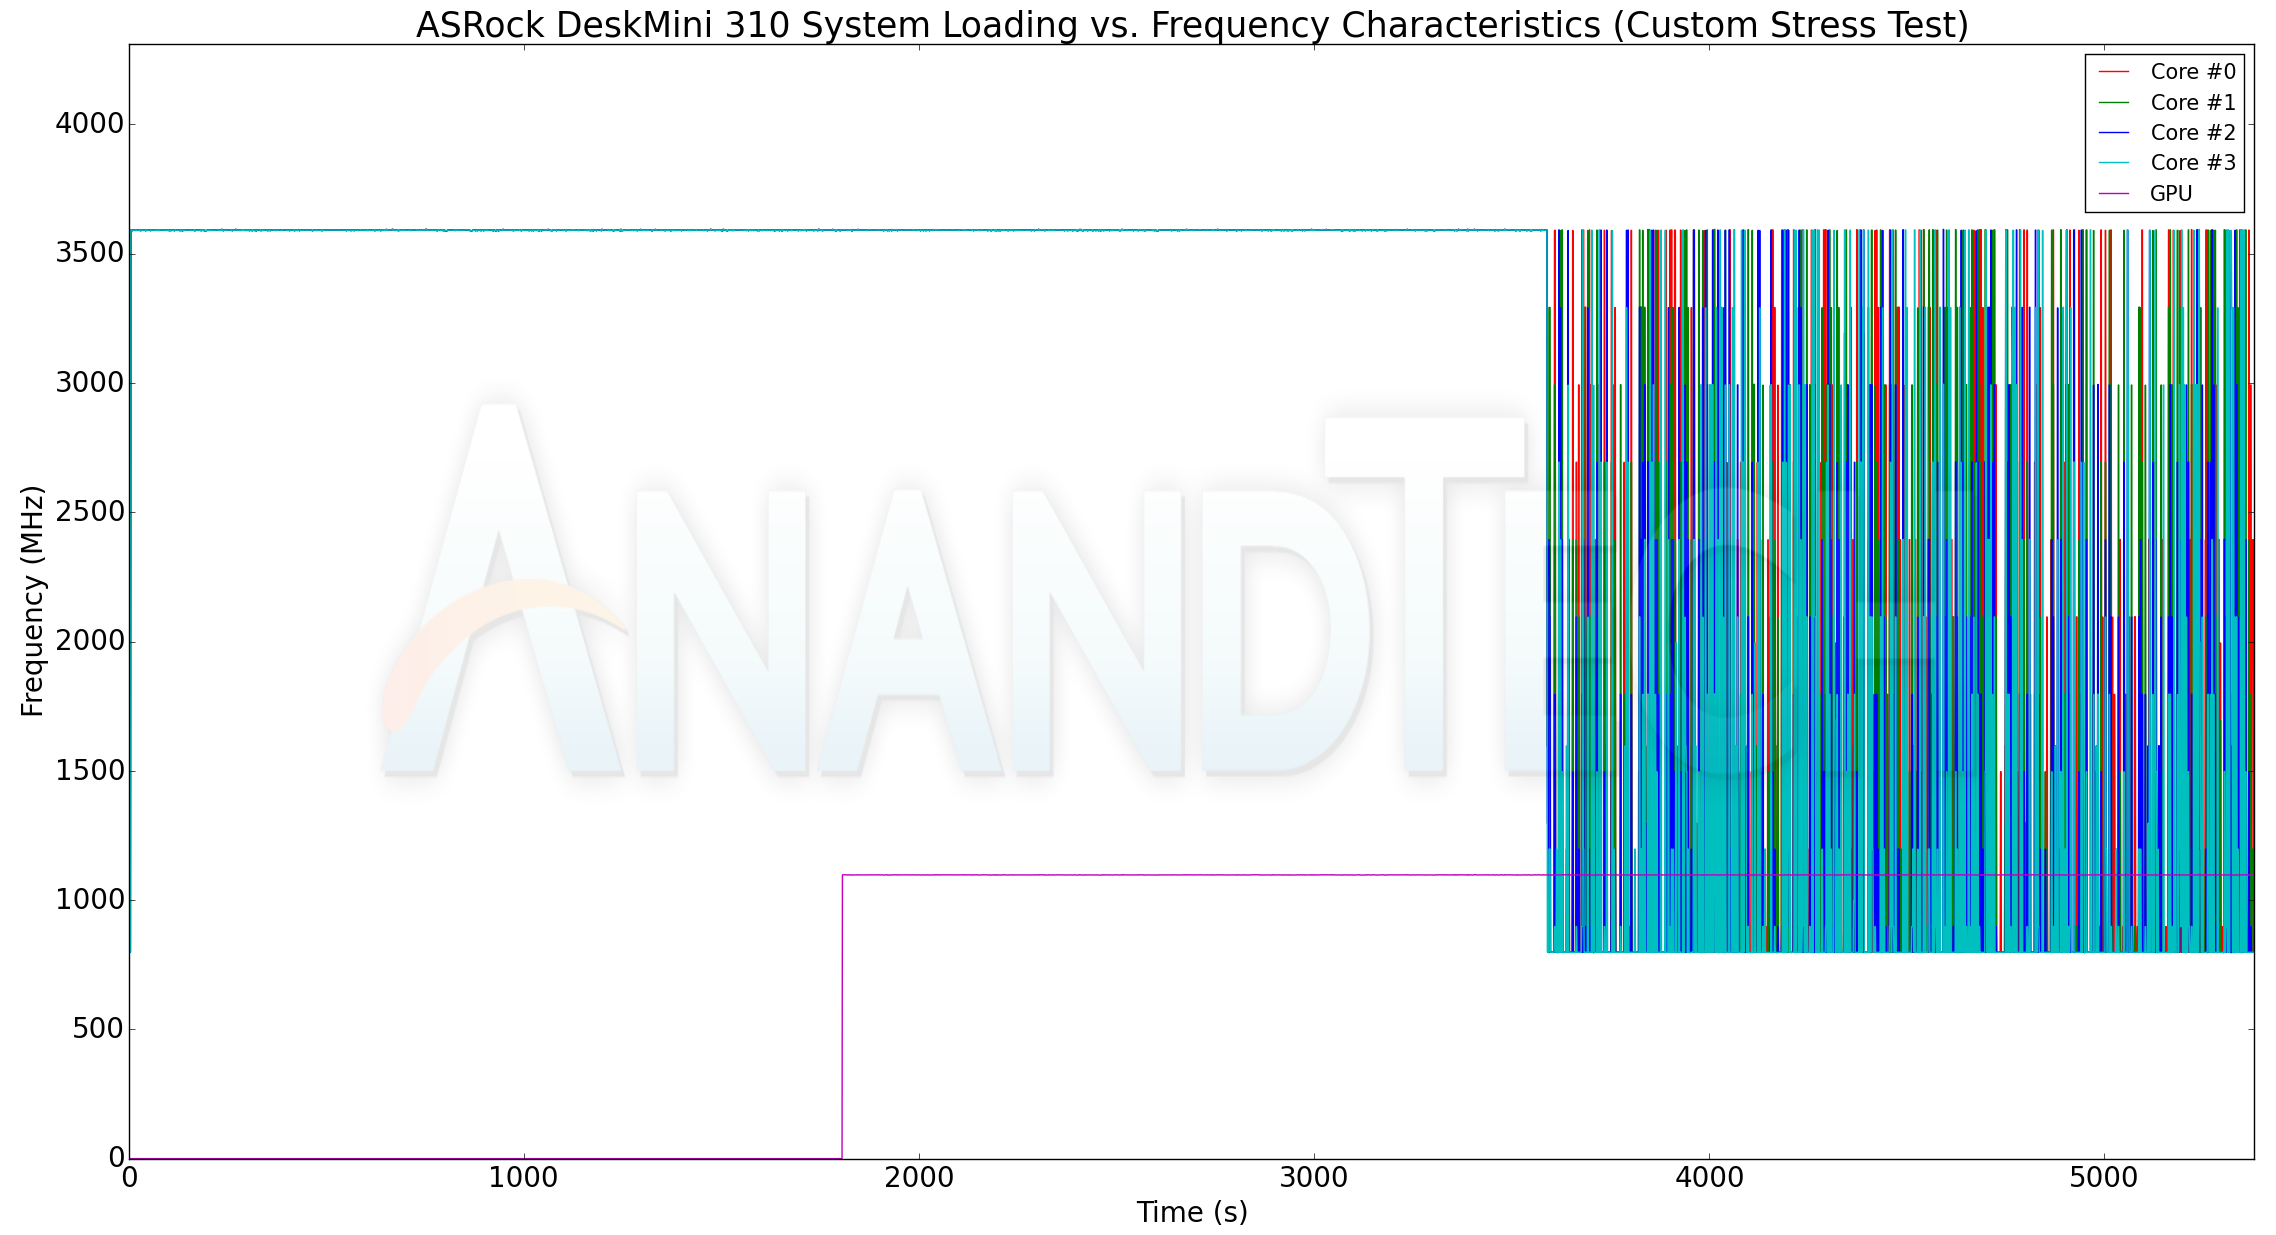
The thermal solution is easily able to support the maximum clock frequency (3.6 GHz) for all the four cores. The GPU also cranks up to 1.1 GHz with the GPU active. The maximum internal temperature observed is only 71C for the cores. The power consumption numbers present an interesting story. It appears that the CPU starts off with a 35W power budget for the package, which then goes up to 42W (and the temperature flattens out around 71C at this power point). With only the GPU active, the package power drops to 40W. The peak at-wall power consumption seems to be around 71W.
Concluding Remarks
In this review, we were able to gather an idea of how the DeskMini 310 fares across a range of benchmarks. These cover most productivity workloads. However, two fairly important segments - gaming and performance for HTPC workloads - were not quantitatively investigated. The mini-STX form-factor is simply not amenable to the former, as the integrated GPU in the 8th and 9th Generation CPUs is not suitable for extensive gaming. For the latter, the focus on affordability has prevented ASRock from integrating a HDMI 2.0 port. The chassis is well-ventilated, but, the lack of any noise dampening means that the system is not as quiet as what one would expect from a HTPC. In any case, the Beebox series is more suitable for that market segment. The DeskMini 310 has its own target market in the business space, and it delivers a very cost-effective solution in that niche.
The mini-STX form-factor allows users to install powerful high-TDP processors in a compact, yet, flexible machine. While ASRock has premium machines with discrete GPUs in the micro-STX line (such as the DeskMini Z370 GTX), the main focus of the mini-STX suite is affordability. The H310 is a low-end chipset meant exactly for this market segment, and system vendors need to design the platform very carefully to get around its limitations. The enabling of the M.2 SSD slot with PCIe lanes directly from the CPU gets around the bandwidth constraints imposed by the PCIe 2.0 links in the H310 PCH.
It may be easy to provide ASRock with a list of needed improvements - say, a couple of USB 3.1 Gen 2 ports, or, even Thunderbolt 3. But, one also has to keep in mind that the DeskMini 310 is an entry-level product with the H310 PCH. Despite the usage of this low-end chipset, ASRock has delivered a fairly flexible barebones PC for just $162. Our only complaint about the price is that the DeskMini 110 with similar characteristics was introduced at $130 (and is still being sold in the channel at that price). In any case, the price includes the Wi-Fi module, chassis, and power supply also - aspects overlooked by DIY builders who may be able to source much cheaper mini-ITX boards. Assembling the DeskMini 310 is not as straightforward as the NUC. For example, mounting the Wi-Fi module and routing the antennae may be a time-consuming exercise for those unaccustomed to DIY builds.
ASRock's BIOS quality and feature set in the mini-PC space is perhaps surpassed only by Intel in their NUCs. The DeskMini 310 launched with support only for the 8th Gen processors from Intel. However, a BIOS updated issued last month now enables users to install 9th Gen CPUs in the unit. As mentioned earlier, the mini-STX platform appears to be geared towards long life-cycle products. So, it is satisfying to see ASRock continue to devote resources to entry-level products such as the DeskMini 310.


